

The digital asset market in this year 2026 keeps the crypto community on edge as Stellar (XLM) fundamentals mature. Although the token posts cumulative losses of 57.83% over the last 12 months and a slight 5.27% year-to-date pullback, the real interest lies in the short term. With a 12.46% gain accumulated over the last three months, XLM’s daily chart (1D) reveals one of the most instructive battles of the year between remaining supply and early institutional buyers accumulating strategic positions.
Below, we analyze at a microstructural level how candlestick price action anticipates the resolution of this decisive compression phase.
Anatomy of Price Action: From the Bear Breakout to the Micro Range
Rigorous technical analysis of the current structure demands dissecting the order flow bar by bar, revealing the mechanical failures of the bearish force and the growing defense from bulls.
The Initial Descent: Bars 22 to 30
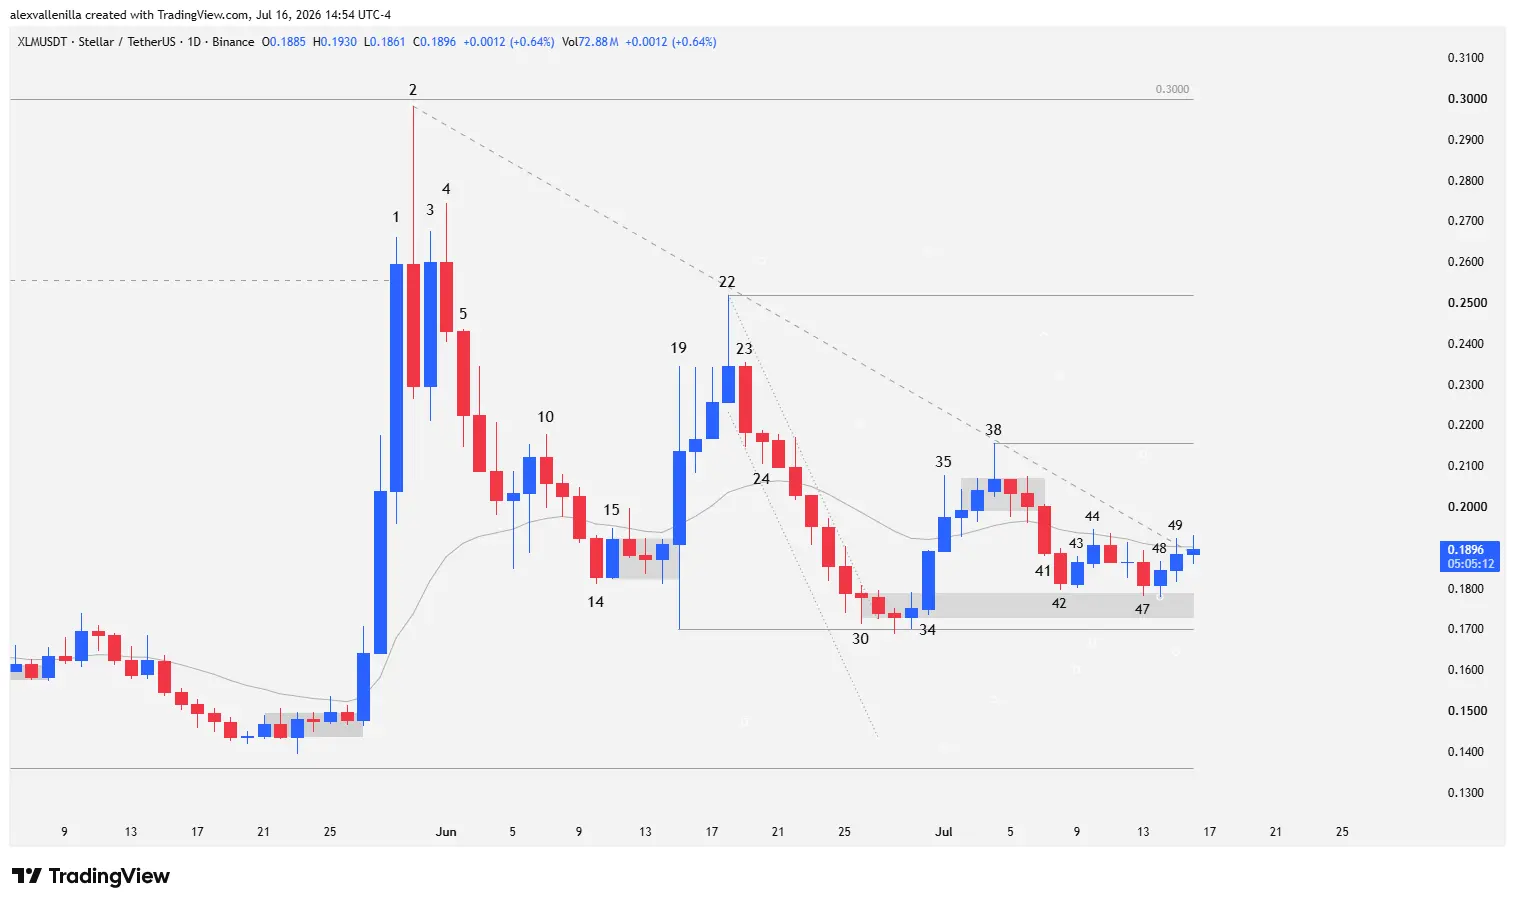
Bar 22: Price establishes a new lower high within the 47-bar secondary downtrend. This bar acts as the anchor point for the resistance. Following a bull trap, Bar 22 prints a prominent upper tail that dwarfs its real body, denoting aggressive selling absorption. Additionally, it consolidates as an EMA Gap Bar (a bar that opens and trades entirely above the 20-period exponential moving average without touching it). In mature downtrends, these anomalies function as lethal traps and powerful short-sell signals. In fact, pressure had been building since Bars 19, 20, and 21, all featuring extended upper wicks.
Bar 23: Acts as a confirmation and pullback candle, closing decisively below the low of Bar 22.
Bar 24: Sellers print a Low 2 short setup bar under the influence of the primary bearish bias, where any bounce is immediately absorbed by floating supply.
Bar 25: Formally breaks the previous low of Bar 24, triggering sell stops. Price quickly slides into a tight, accelerated downtrend, a phenomenon technically known as a bear breakout.
Stabilization and the Unyielding $0.17 Support
The bearish momentum finds its first real brake as it approaches historical demand levels, giving way to a textbook structural transition.
Bar 30: As it collides with the critical support zone of $0.17 (the low of Bar 19), the first relevant deceleration appears. Bar 30 fails to close below the low of Bar 29. In fact, it does not even touch the $0.17 level. This exhaustion breaks the previous bearish micro-channel and traps the price in a lateral congestion phase or micro range.
Bar 34: Buyers break the congestion to the upside with a solid, wide-range bar, though without enough inertia to test the 20-period EMA.
Bar 35: Offers immediate continuity and manages to close above the 20 EMA, but the appearance of a large upper tail equivalent to its body size warns that bears continue to absorb liquidity. Nonetheless, the $0.17 support begins to look unyielding.
Bar 38: Its high serves as the anchor for the short-term bearish counter-trendline. Price compresses within this equilibrium pattern without apparent direction, printing a relative lower high compared to Bars 2 and 22.
Extreme Compression and Supply Exhaustion
The latest bars on the daily chart denote a dramatic loss of momentum by sellers, which often precedes an explosive expansion move.
Bars 41 and 42: Bears trigger a temporary breakout of the micro range, dragging price back to the 20 EMA. However, Bar 42 materializes with a tiny range, failing to threaten the $0.17 support and marking a higher low relative to Bar 32.
Bars 43 and 44: Bulls stop the decline with narrow-range bars. Bar 44 momentarily pierces the 20 EMA without securing a net close above it.
Bar 47: A new bearish attempt to pierce the 20 EMA fails due to extreme volatility contraction (a minuscule range). This inability to test the lower support locks the price into an even tighter range.
Bars 48 and 49: Bar 48 completely invalidates the previous bearish fakeout. Immediately after, Bar 49 breaks above the previous high, though the 20 EMA continues to act as a dynamic ceiling.
Technical Diagnosis: An Exhausted Three-Push Pattern
Structural analysis shows that XLM is in a phase of distributive accumulation. The 47-bar secondary bearish cycle completed a classic three-push bearish pattern:
First Push: From the high of Bar 2 to the low of Bar 14.
Second Push: From Bar 22 to Bar 30.
Third Push: From Bar 38 to Bar 42.
The analytical key lies in the fact that this third push is notably smaller and weaker than its predecessors, culminating in a higher low. This proves that selling pressure is exhausted and that institutional demand is absorbing all available paper in the $0.17 zone, using the heavy volatility of Bar 19 as a clearing pivot.
At the time of writing, bulls are trading slightly above $0.18, trying to definitively break the primary downtrend line. The priority short-term target is to beat and consolidate above the high of Bar 38, located at $0.2157. Breaking above this level will invalidate previous traps and trigger a medium-term bullish structure. Otherwise, losing the $0.17 support will reactivate the larger bearish bias toward the next key structural support at $0.1361.
Disclaimer: The information presented in this analysis is for educational and informational purposes only and does not constitute investment advice or any financial recommendation.

Communications Professional. Crypto Enthusiast. Economic Journalist. Bitcoiner & Altcoiner.


