

The crypto ecosystem is witnessing one of the most aggressive structural transformations of the year. The cryptocurrency DEXE woke up from a slumber of more than four years after breaking through a historic resistance that remained inactive for 1,671 days. The movement, which began with a high-conviction institutional breakout, catapulted the price parabolically to establish a new all-time high at $49.43. Currently, the asset undergoes a healthy technical correction where buyers aggressively defend the confluence zone at $32.91, a level that determines whether the rally maintains its fuel or gives in to profit-taking.
The Structural Awakening of DEXE
The digital asset market rewards long-term price compression, and the recent movement of DEXE is a textbook example. After a prolonged period of latent accumulation, the buy order flow completely absorbed the floating supply. This structural breakout not only alters high-frequency trading algorithms but also transforms the token’s macroeconomic narrative, attracting interest from institutional investors and retail traders looking to ride the new trend.
The verticality of the momentum confirms that smart money detected asset scarcity, utilizing the exposed liquidity above old technical ceilings to accelerate the price without giving any respite to lagging sellers.
Advanced Technical Analysis: Price Action Radiography
Candlestick behavior on the daily chart (1DS) exposes an accelerated wealth transfer and a subsequent absorption phase that maps out the exact psychology of the participants.
The Breakout of the 1,600-Day Wall (Bar 1)
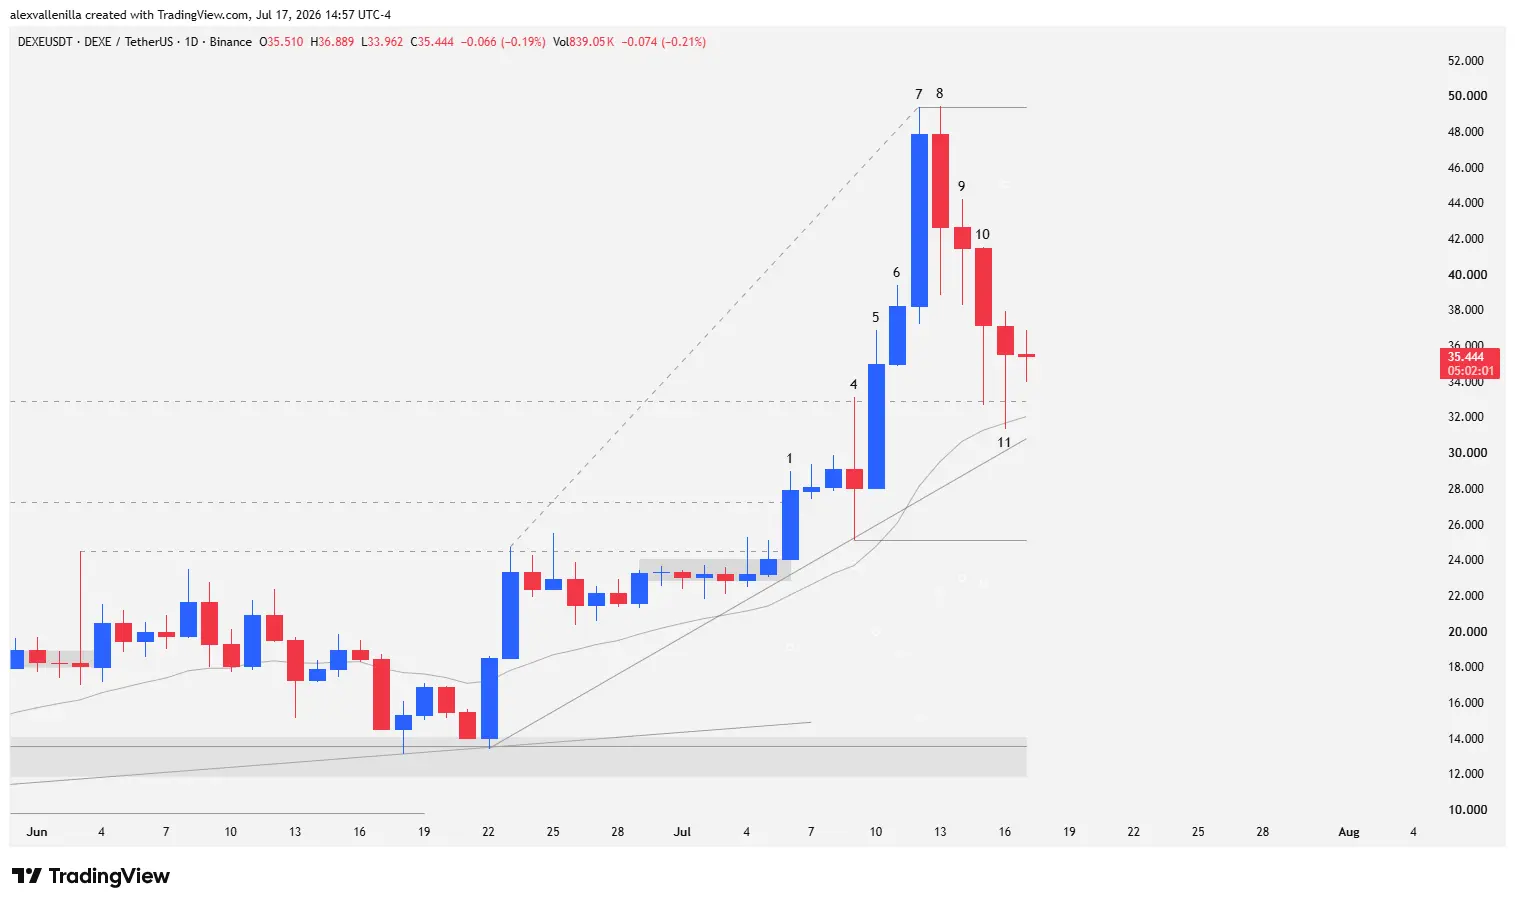
Bar 1 validates the start of the bullish cycle with a wide-range, high-conviction candle. This move destroys the intermediate resistance at $24.49 (the peak of the previous push) after a pinpoint retest of the 20-period exponential moving average (20 EMA). The truly relevant milestone is the breakthrough of $27.23, a high-liquidity node that the price had not visited for 1,671 bars. This clean breakout clears the path toward the old All-Time High (ATH) located at $32.91.
ATH Clash and Market Indecision (Bar 4)
Price velocity finds its first natural brake at the summit. Bar 4 prints a long-legged Doji with prominent shadows (tails) on both ends. Bulls and bears unleash a violent battle for control of the order flow. Although buyers manage to stretch the price slightly to a new ceiling at $33.10, the neutral close reflects indecision. The low of this bar acts as a fundamental pivot, serving as an anchor to draw an uptrend line that structures the last 25 sessions and recording a higher low relative to Bar 1.
Institutional Response and Parabolic Climax (Bars 5 to 7)
Detecting the bears’ inability to sink the price, strong hands re-enter the market. Bar 5 opens and immediately trades higher, setting up a firm-conviction buying candle with a completely shaved base (opening marubozu), which demonstrates an urgency to buy at higher prices. Bar 6 provides immediate continuity to the move and closes above the previous high.
Euphoria reaches its peak in Bar 7, a climactic vertical acceleration candle that establishes a new all-time high at $49.40. This momentum overextends the 25-bar structure, completing a second leg up within a macro ascending widening wedge pattern, a formation that warns of temporary buyer exhaustion.
Profit-Taking and Supply Absorption (Bars 8 to 11)
Bar 8: Bulls force one final extension to $49.43, but the price capitulates to profit-taking and closes lower. Although the range covers almost the entire previous candle, bears fail to break its low. The long lower tail reveals that demand absorbs selling at the highs.
Bar 9: Bears attempt to deepen the retracement by marking a lower low, but they cannot sustain the pressure. The session closes with a tiny body overlapping within the previous range, forming a hammer that exposes the sellers’ loss of strength.
Bar 10: The correction continues in an orderly fashion and without panic selling. The candle body remains trapped within the range of Bar 9, reflecting that bears are only taking profits without executing aggressive short positions. The lower shadow matches the body size, validating the first active defense of the old ATH turned support at $32.91.
Bar 11: This session prints a hammer or pinbar of high technical relevance. The huge lower tail temporarily pierces the $32.91 support and the 20 EMA, but snaps back quickly without touching the 25-bar uptrend line. The body closes flat and overlapping, confirming that buyers block the bearish advance and successfully defend the structural confluence zone.
The Structural Verdict
DEXE stands at a decisive technical crossroads. The transition from climactic momentum to the current correction phase demonstrates remarkable structural health so far. If buyers manage to validate the bounce off the confluence of $32.91, the 20 EMA, and the uptrend line, order flow will drive the price to retest the $49.40 resistance. In the alternative scenario, if supply breaks this defensive bastion, the price will seek the fortified institutional point of control at $25.11.
Disclaimer: The technical analysis and opinions expressed in this article are for educational and informational purposes only. They do not constitute financial advice, investment recommendations, or an offer to buy or sell digital assets. Trading in the cryptocurrency market carries a high risk of capital loss.

Communications Professional. Crypto Enthusiast. Economic Journalist. Bitcoiner & Altcoiner.


