

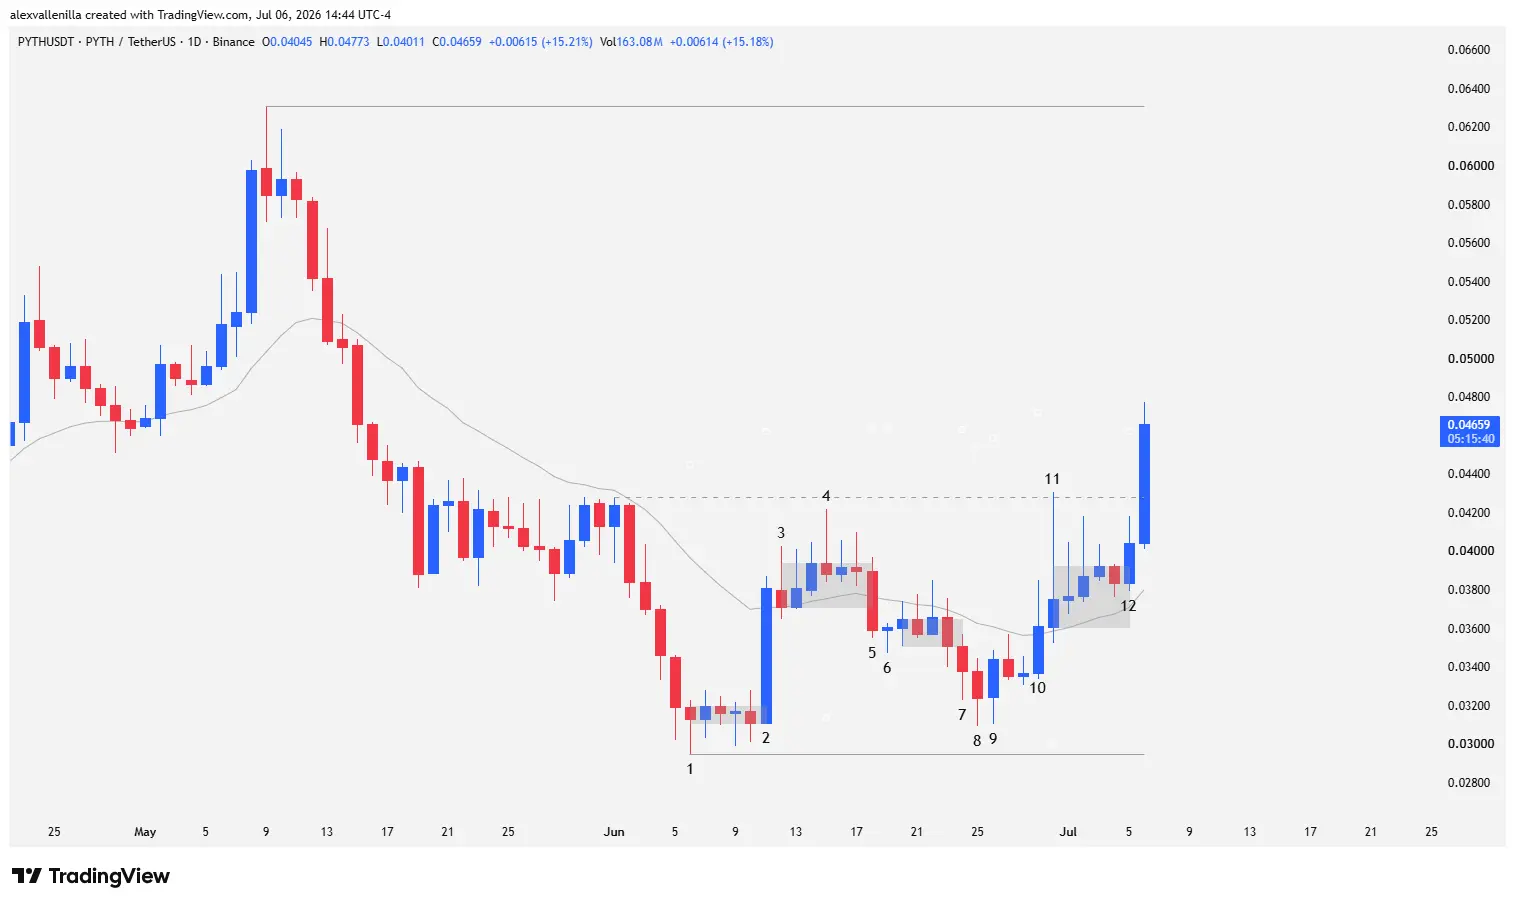
The Pyth Network (PYTH) token is fighting to consolidate a structural bullish reversal after recently plunging to its all-time low of $0.0295. Following a heavy injection of institutional capital detected directly in the price action, buyers are storming the key resistance at $0.0428, racking up daily gains of over 15% and opening up a technical path toward $0.0631.
PYTH’s Macro Context: Searching for a New Structure
The price of PYTH carries a long-term bearish trend that eroded the asset’s value down to unprecedented levels. However, current order flow dynamics suggest a change of hands. The market is attempting to build a solid reversal structure. To validate this medium-term scenario, bulls need to flip the local resistance at $0.0428 into an operational support and subsequently tear down the main wall at $0.0631, which represents the last relevant lower high of the primary markdown.
Detailed Technical Analysis: Bar-by-Bar Chart Psychology
To understand the anatomy of this move, we analyze the pure price action through candlestick behavior and its interaction with the 20-period exponential moving average (20 EMA).
Phase 1: All-Time Low and Institutional Awakening
Bar 1: This candlestick marks exhaustion and the end of a two-legged bearish move extending from the $0.0631 high. The low of this bar establishes critical support at $0.0295, the lowest level in the cryptocurrency’s history. Afterward, price enters a tight congestion pattern (barbed wire) for four bars, respecting the support zone but showing clear indecision.
Bar 2: A massive bullish candlestick breaks the monotony. It features a solid body and a close with a tiny upper wick. This setup technically qualifies as an institutional capital entry. Smart money takes control, injects buying volume, and breaks above the 20 EMA, neutralizing the prior bearish pressure.
Bar 3: Bears attempt to respond with an immediate pullback, denying the previous bar’s bullish continuity. Price enters a new sideways equilibrium range above the 20 EMA for the next five candles.
Phase 2: Range Traps and Supply Absorption
Bar 4: Buyers attack the local resistance at $0.0428, but overhead supply frustrates the move. Sellers print a pinbar with a highly pronounced upper wick, demonstrating control at higher prices.
Bar 5: Selling pressure materializes and breaks below the congestion pattern, forcing price to trade under the 20 EMA.
Bar 6: A tiny bullish candle temporarily halts the decline. By failing to close below the low of Bar 5, it invalidates immediate bearish continuity. Nonetheless, price gets stuck again in a barbed wire pattern below the 20 EMA for four sessions.
Bar 7: Bears break the lethargy with an intraday bearish candle, but a lower wick matching the body’s size reveals aggressive supply absorption by bargain hunters.
Bar 8: This bar attempts to resume the sell-off from the previous candle, but its body completely overlaps with Bar 7’s range and fails to close below its low. This deceleration leaves a significant lower wick and, most importantly, the low fails to retest the all-time low of $0.0295. This gap with the all-time low completes a two-legged bearish cycle from the Bar 4 high, signaling an imminent reversal.
Phase 3: Structural Reversal and the Current Assault
Bar 9: A bullish outside bar appears. This reversal pattern engulfs the prior price action and stops the bleeding dead in its tracks. The lack of bearish continuity from Bar 7, combined with Bar 8’s inability to touch the absolute bottom, confirms the correction has ended.
Bar 10: Bulls launch an aggressive attack, ramping up volatility. They successfully catapult price over the 20 EMA, though bears absorb some demand at the close, leaving an upper wick equal to the body size.
Bar 11: Volatility explodes. Buyers furiously test the local resistance at $0.0428. However, massive sell orders absorb the buying pressure, printing an extreme pinbar with an upper wick four times the size of its body. Volatility immediately dissipates, and price compresses into tiny bars with two-way wicks, though they manage to hold above the 20 EMA.
Bar 12: Bulls slightly break the tight congestion but lack the momentum needed to test the Bar 11 high.
Current Bar Situation and Projections
Live Price: At the time of writing, the current bar trades firmly above $0.04, printing an intraday gain of over 15%.
The developing candle maintains strong momentum and actively breaks the local resistance at $0.0428. By clearing this key high, PYTH invalidates the immediate bearish structure and triggers a measured move pattern. If we take the distance of the first bullish impulse (from the Bar 9 low to the Bar 11 high) and project it, bulls could execute a symmetrical second leg with a direct technical target at the main resistance zone of $0.0631.
Conversely, if bulls fail to secure the current candle’s close above $0.0428, price will seek demand at the dynamic support provided by the 20 EMA, currently sitting at $0.0380. Given the clear institutional footprints visible on Bar 2 and in today’s session, the technical odds favor the buyers.
PYTH completed a short-squeeze cycle after indirectly holding above its all-time low. The constant absorption of sell orders and the aggressiveness of the current bar show that institutional money has started positioning in the decentralized oracle. Sustaining the current close above the $0.0428 zone will dictate the rules of the game for the rest of the quarter.
Disclaimer: This technical analysis relies exclusively on price action and market data provided for educational and informational purposes. It does not constitute investment advice, financial recommendations, or an invitation to trade digital assets under any circumstances. Cryptocurrencies experience extreme volatility; only risk capital you are willing to lose.

Communications Professional. Crypto Enthusiast. Economic Journalist. Bitcoiner & Altcoiner.


