

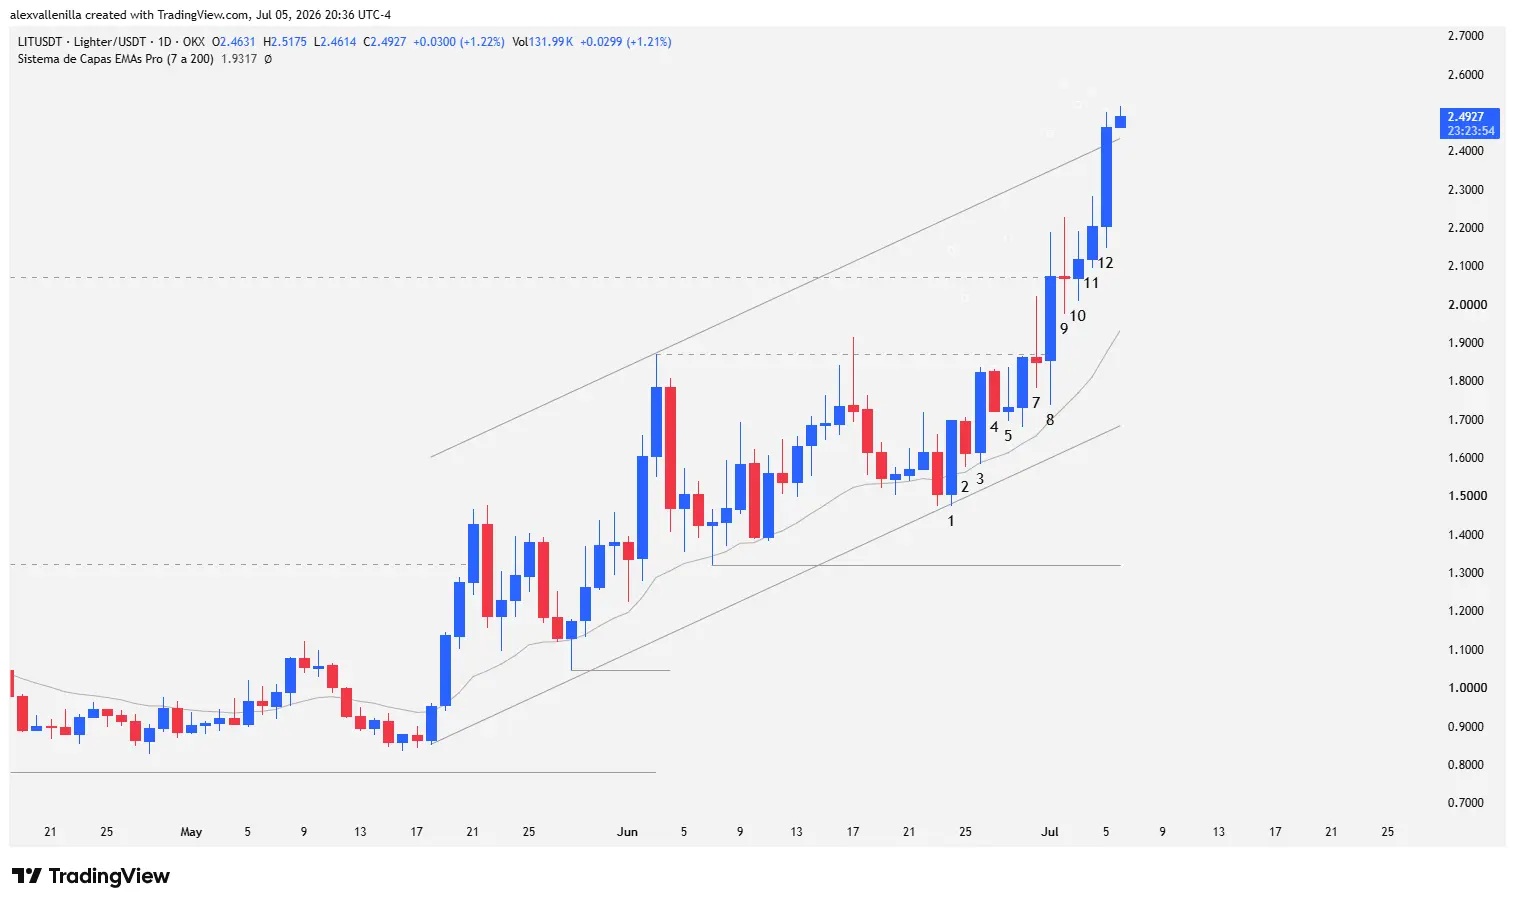
The digital asset market is turning its spotlight back to the LIT token. After consolidating a solid bullish structure over the last 49 sessions, the cryptocurrency experienced a notable institutional acceleration that shattered its all-time high of $2.07. This move pushes the asset into a price discovery phase. However, the latest climatic price action suggests the market could face an imminent correction due to dynamic overbought readings.
The Anatomy of the Momentum: Order Flow and Invalidations
LIT‘s recent move demonstrates how institutional order flow systematically absorbs selling pressure. The current trend is no coincidence; it responds to a series of structural failures where bears attempted, without success, to take control of the market, triggering short-position capitulations and fueling the bullish advance.
Chart Breakdown: A Candle-by-Candle Battle
Detailed price action analysis of the recent bar sequence reveals participant psychology and the underlying strength behind this rally:
Bar 1: Institutional buyers (strong hands) enter the market with a high-conviction candle. This move completely invalidates the previous session’s attempted breakdown of the 20-period exponential moving average (20 EMA), setting up a failed breakout that reactivates the bullish structure.
Bar 2: Sellers attempt to push a pullback but lack the necessary strength. The low of this bar fails to even test the 20 EMA, exposing weak supply.
Bar 3: A new high-conviction bullish bar confirms institutional presence. Strong hands invalidate the prior bearish feint, executing a failed pullback. The high of this bar targets the key resistance at $1.87, a level that coincides with the previous swing high.
Bar 4: Supply tries to push again, but the market only produces minor consolidation through a bearish inside bar.
Bar 5: An outside bar develops. Although bulls print a higher high, the upper wick or tail is considerably large compared to its body. Failing to show continuation characteristics, it reflects temporary demand exhaustion.
Bar 7: Buyers decisively pierce the $1.87 resistance. However, bears react and gain ground before the close, printing a pin bar with an extensive upper tail. Price fails to sustain itself above and closes below the key zone.
All-Time High Breakout and Institutional Climax
True volatility erupted in the second half of the sequence, permanently transforming the crypto asset’s technical structure:
Bar 8: Volatility explodes with a wide-range bar. Extensive upper and lower tails evidence a fierce battle between supply and demand. Despite the candle’s intrinsic uncertainty, bulls manage to close the price above $1.87. Furthermore, the high pierces the all-time high located at $2.07 (the peak of the last macro downtrend), securing a subtle but firm close above this level.
Bar 9: Bears attempt another pullback but only print a doji candle. Lacking a defined body, the market interprets this pullback as extremely weak.
Bar 10: An inside bar dominated by buyers appears. By aborting the previous session’s continuity, the market validates a failed pullback that attracts additional buy order flow.
Bar 11: Bulls capitalize on the setup and provide immediate continuation to the bar 10 failure.
Bar 12: Institutional buyers unleash massive buying pressure at increasingly higher prices. This bar breaks and closes above the upper line of the short-term ascending channel. By accelerating the price vertically outside its technical boundaries, the session classifies as a climatic extension.
Technical Outlook: Sustainability or Dynamic Correction?
LIT has accumulated 49 bars within a flawless ascending structure. After convincingly breaching its all-time high, the asset formally enters a price discovery phase, meaning the market lacks horizontal resistance references or defined ceilings in the short term.
However, the climatic acceleration observed in bar 12 flashes overbought warning signs. If buyers fail to sustain the vertical pace, the price will seek lower liquidity pools to balance the order flow. In this pullback scenario, the first key dynamic support to monitor rests at $1.93, a technical confluence zone that could act as a buffer before a new bullish attempt.
Disclaimer: This analysis is issued exclusively for informational and educational purposes. It does not constitute under any circumstances an investment recommendation, financial advice, or an incitement to trade crypto assets.

Communications Professional. Crypto Enthusiast. Economic Journalist. Bitcoiner & Altcoiner.


