

The governance token DEXE is accelerating its bullish momentum in the digital finance market after validating critical support and breaking out of a structured 137-bar channel. Driven by an aggressive injection of institutional capital, the cryptocurrency is capitalizing on an impressive 788.30% year-to-date return in 2026. With the price piercing long-term resistance levels, technical buyers are now targeting a retest of the $32.91 all-time high, defying the typical exhaustion seen in advanced distribution phases.
The Institutional Awakening: Structure and Macro Context of DEXE
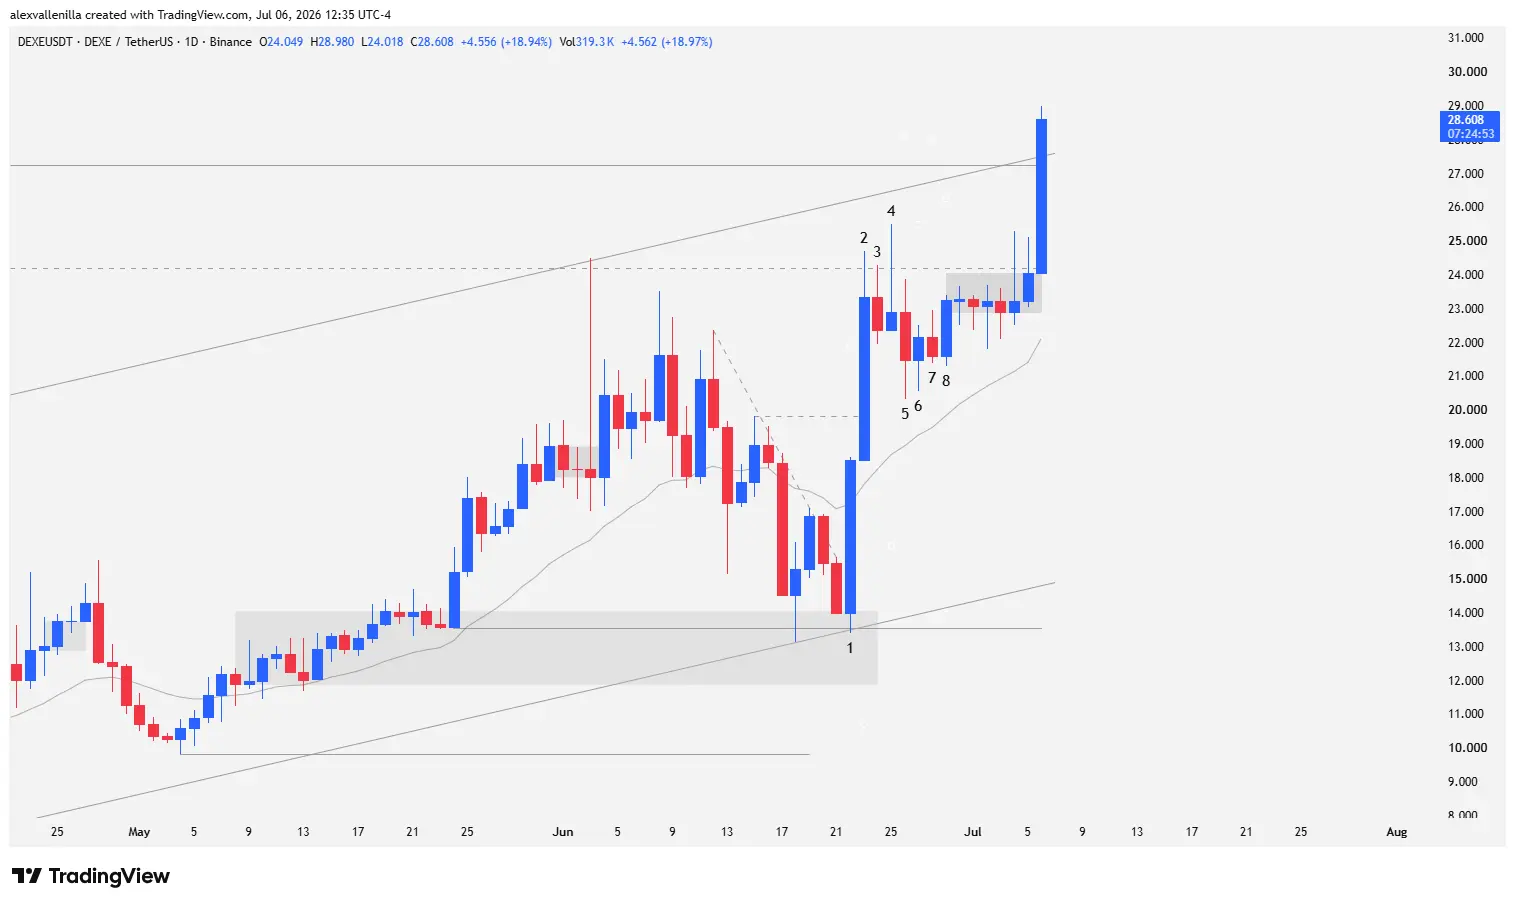
DEXE price action shows a notable transition from a prolonged accumulation period to a vertical acceleration phase. The asset had been developing a primary 137-bar bullish channel, undergoing a healthy correction after completing a prior bullish impulse of two long, gradual legs.
This operational pause functioned as a reaccumulation zone for market smart money, who stepped in decisively to defend the local support zone. The technical strength of this move definitively invalidates previous bearish microstructures, paving the way for a highly structured uptrend on macro timeframes.
Candlestick Anatomy: Technical Analysis and Order Flow
Price behavior, broken down bar by bar through order flow and price action psychology, reveals the following narrative:
Bar 1 (High-Conviction Candle): Institutional capital aggressively enters the market. The low of this session validates key support at $13.53, forming a highly reliable double-bottom pattern. This bar decisively breaks above the 20-period exponential moving average (20 EMA) and invalidates a 9-bar bearish micro-channel that was acting as a correction.
Bar 2 (Bullish Confirmation): Smart money reaffirms the previous bounce, printing another wide-range bar with a tiny upper wick. This move fractures local resistance at $19.80 and tests a critical level at $24.19 (a 518-bar technical node that confluences with the high of the last impulse). However, selling pressure prevents a close above this level.
Bar 3 (Bearish Consolidation): Following the bullish effort, an inside bar contraction emerges where bears attempt to lock in partial profits, though without triggering a deep retracement.
Bar 4 (Rejection Pinbar): Buyers attack the $24.19 resistance again but fail. The price closes at the bottom of the session and prints a pinbar with a prominent upper wick, confirming that supply is actively defending the level. However, because it fails to pierce the low of Bar 3, the session generates an initial pullback failure.
Bar 5 (Limited Bearish Expansion): Sellers manage to breach the low of Bar 4 to trigger a formal retracement. Despite the attempt, selling order flow exhausts itself before testing the 20 EMA, demonstrating the weakness of the bearish counteroffensive.
Bar 6 (Failure of Continuity and Inside Bar): The market experiences a volatility contraction. An inside bar prints with a bullish close that neutralizes the Bar 5 drop, establishing the fourth naked bar since Bar 3 and confirming the definitive failure of the pullback.
Bar 7 (Dynamic Congestion): Bears block the immediate continuity of the previous reversal. The price enters a phase of indecision and temporary equilibrium.
Bar 8 (Barb Wire Pattern): Bulls invalidate the bearish feint of Bar 7, but the market enters a rigorous congestion phase. Consecutive bars exhibit tiny bodies and bidirectional wicks trapped beneath the $24.19 resistance, reflecting severe price compression.
The Current Bar: Climactic Breakout and Market Targets
The current session breaks the market monotony with a highly convincing bullish bar. Showing no wick at its bottom, the chart reveals that buyers dominated order flow from the institutional open.
Currently, the price is consolidating above a historical resistance level that had not been breached in 1,671 bars. By simultaneously breaking the upper boundary of the 137-bar bullish channel, DEXE exhibits signs of vertical acceleration.
If the current momentum consolidates a symmetric second bullish leg from the Bar 1 pivot, the asset clears the path to target the all-time high located at $32.91. Conversely, due to the climactic nature of the current bar, the market could experience a healthy technical pullback; in that scenario, if bulls fail to sustain the breakout above $27.23, the dynamic support zone to watch sits firmly at $22.10, guarded by the 20 EMA.
The dizzying technical evolution of DEXE confirms that the token has left retail speculation ranges behind to enter the radar of institutional positioning. With a year-over-year return of 279.56% over the last 12 months and a stunning 788.30% so far in 2026, the sustainability of the trend will depend on validating its dynamic supports against all-time highs.
Disclaimer: This analysis is presented solely for informational and educational purposes based on price action. It does not constitute, nor should it be interpreted as, investment advice, financial counsel, or an invitation to trade digital assets. Every trader is responsible for their own risk management.

Communications Professional. Crypto Enthusiast. Economic Journalist. Bitcoiner & Altcoiner.


