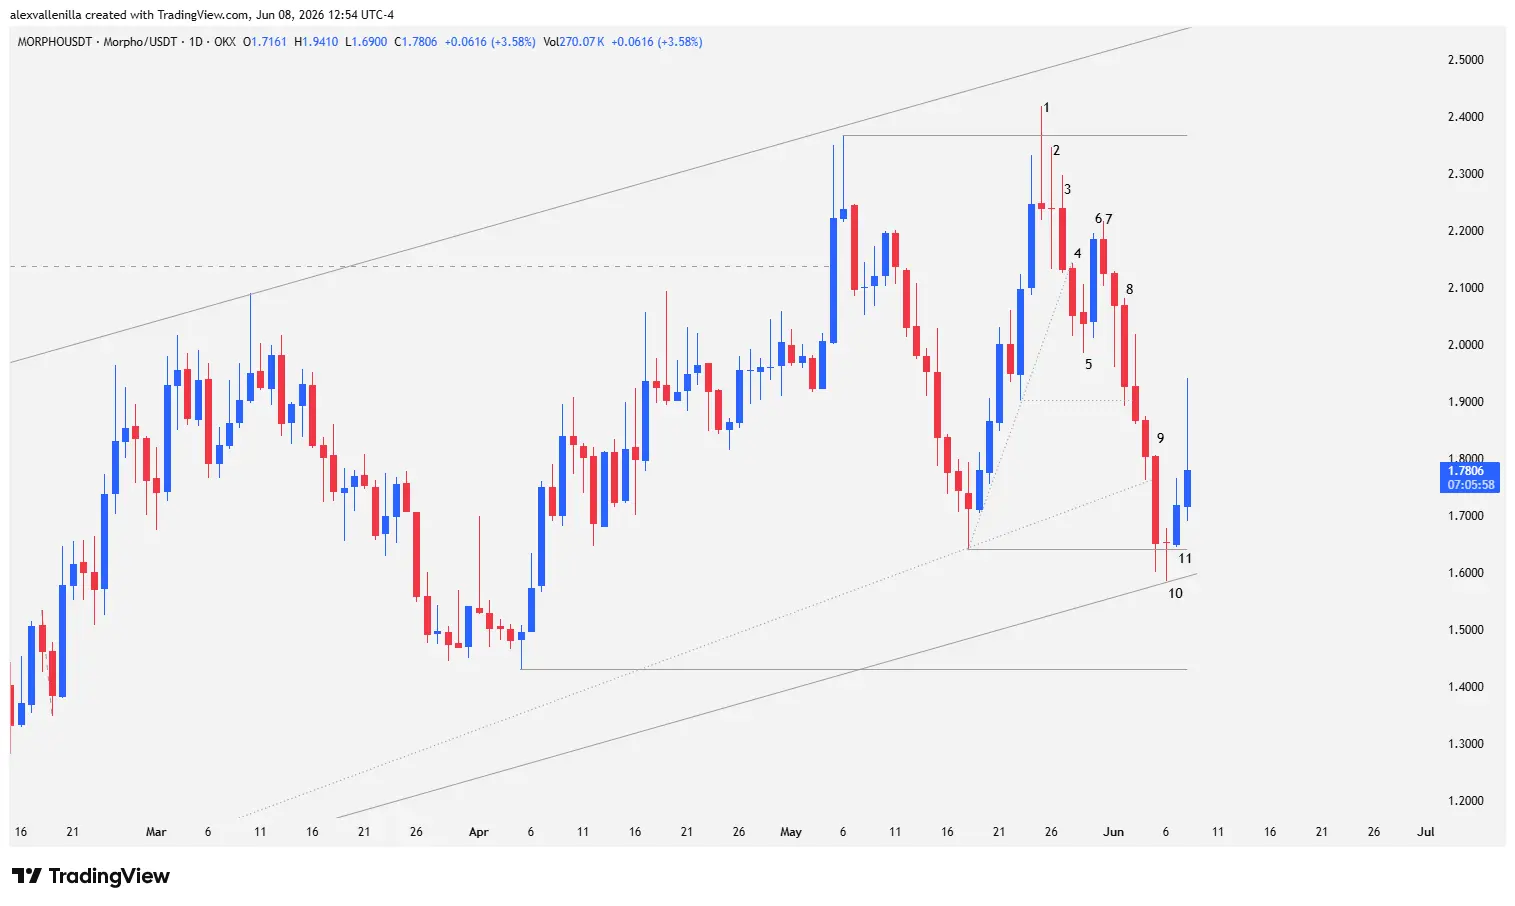
The cryptocurrency market does not forgive fatigue, and MORPHO just experienced a masterclass in Price Action on its daily (1D) chart. Following a prolonged effort to build a macro recovery structure, buyers capitulated exactly at the critical $2.3678 resistance. This sharp rejection triggered a deep two-legged correction that pierced micro-channels and forced a technical adjustment to its main ascending channel, which now extends to 123 bars. The inability to sustain the previous institutional momentum opens a period of high volatility and defines vital support zones for the trend’s survival.
The $2.3678 Wall: The Psychology of the Failed Three-Push Pattern
Price action on MORPHO reflects an intense psychological battle at the top of the chart. The cryptocurrency had been developing a solid bullish structure after breaking a heavy, previous 176-bar downtrend. However, as it approached key resistance levels left by bears in the past, buyers’ fuel began to run out.
Price attempted to establish itself above the previous resistance at $2.1381—a relevant bastion of the old bearish regime. Although a previous push managed to trade momentarily above $2.1349, the real mathematical and psychological problem consolidated at $2.3678. In this zone, the market completed a three-push pattern, where the final attempt showed a severe loss of momentum, printing a double top with the high of the second overall push.
Anatomy of the Capitulation: Bar-by-Bar Price Action Analysis
To understand the speed of the pullback, it is essential to dissect the order flow and mass psychology reflected in the last 11 sessions of the daily chart:
The End of Momentum and Bearish Confirmation (Bars 1 to 4)
Bar 1: Bulls suffer a millimetric rejection at the $2.3678 resistance. The session prints a textbook pinbar with a massive upper tail and a tiny body at the top of the cycle. This breakout failure fails to test the upper boundary of the projected ascending channel, revealing that institutional demand is withdrawing on this third push. The high of this bar fails to test the channel’s upper line, confirming weakness.
Bar 2: A washout or liquidity sweep high prints below the resistance. The session low breaks below the floor of Bar 1. The candle closes as a doji that sows doubt in the market, but structurally validates the bullish failure to breach $2.3678.
Bar 3: An inside bar of consolidation with a bearish close and a lower high relative to Bar 2. Price flirts with testing the previous 10-bar micro ascending channel, demonstrating that buyers are losing the initiative.
Bar 4: Bears take definitive control. This session confirms the micro-channel breakout, validating a short-term trend reversal within the 119-bar macro channel.
Institutional Traps and Climactic Acceleration (Bars 5 to 9)
Bar 5: Another doji introduces confusion into the price action. The candle’s small body fails to close below the low of Bar 4, momentarily holding the drop.
Bar 6: Buyers attempt a reversal with a notable bullish momentum bar that takes out the highs of the two previous sessions. However, the volume and structure do not reach “strong hands” status, anticipating a bull trap.
Bar 7: The market immediately punishes the lack of follow-through. This session acts as a pullback that confirms the failed reversal of Bar 6. Since the highs of both sessions remain far from $2.3678, buying disinterest triggers new sellers. The following candle closes below Bar 7, formally starting a bearish micro-channel.
Bar 8: A high-range session with excellent bearish performance, though it shows a lower tail after piercing the local support at $1.9035 (the control point of the old 10-bar micro-channel). Technically, Bar 8 sets up a high-probability Low 2 short entry signal in the context of the drop from Bar 1. Although the risk-reward ratio was high due to the proximity of the channel’s bottom, the breakout of its low triggered scalpers’ sell orders, pushing price aggressively lower.
Bar 9: The drop accelerates dramatically. This climactic candle decisively breaks the lower side of the ascending channel, closing with 80% of its range below that dynamic trendline. Despite the violence of the move, bears fail to close below the key structural support at $1.6407 (the first control point of the 119-bar uptrend). This marks short-term seller exhaustion and the end of the second bearish leg.
Dynamic Support Reacts (Bars 10 and 11)
Bar 10: A pinbar prints with a virtually nonexistent body, where price opens and closes almost at the same level. The long lower wick serves as an anchor to adjust the dynamic ascending channel, which now recalibrates to 123 bars. This demonstrates a structure that maintains its slope after finding a prior deceleration at the fixed support of $1.4309.
Bar 11: Bulls manage a timid bounce, keeping the low above $1.6407. However, the appearance of an upper tail shows that selling pressure remains latent and that buyers currently lack the power required to reverse the strong previous bearish momentum.
Map of Key Levels for MORPHO
On a structural level, the long-term uptrend remains technically alive within the new 123-bar channel, which formed after shaking off a 176-bar macro downtrend. For MORPHO to challenge the bears’ “last bastion” at the critical resistance of $2.8593 (the peak of the historical downtrend), it must first heal the wounds of this pullback.
The most likely short-term scenario is a transition into a broad trading range or sideways phase. The boundaries of this playing field are defined by the following levels:
| Operating Level | Price (USD) | Technical Significance |
|---|---|---|
| Ceiling Resistance | $2.3678 | High of the double top and failed three-push zone. |
| Key Structural Support | $1.6407 | First bullish control point; vital defense to avoid a bearish range. |
| Dynamic Support | $1.5982 | Lower side of the readjusted 123-bar ascending channel. |
| Macro Critical Support | $1.4309 | Prior deceleration zone and final safety pivot. |
If bulls manage to defend the confluence block between $1.6407 and $1.5982, the structure will keep its higher lows intact. Otherwise, losing these levels will force a search for liquidity at $1.4309, completely invalidating the optimism of the recent institutional cycle, whose order blocks have been temporarily neutralized.
MORPHO‘s rejection at $2.3678 proves that the market is still processing dense selling memory from the past. Although the correction wiped out the institutional buy signals from the previous micro-channel, resilience at the $1.6407 support keeps the macro structure under buyers’ technical control. The coming sessions will determine whether this pause generates the accumulation needed to definitively break the market to the upside or if bears will extend the capitulation.
Disclaimer: This article is provided for informational and educational purposes only, based on Price Action methodology. It does not constitute financial advice, investment recommendations, or an offer or solicitation to buy or sell any digital asset. Cryptocurrencies represent high-risk, high-volatility assets; always trade under your own responsibility and risk management.
Communications Professional. Crypto Enthusiast. Economic Journalist. Bitcoiner & Altcoiner.