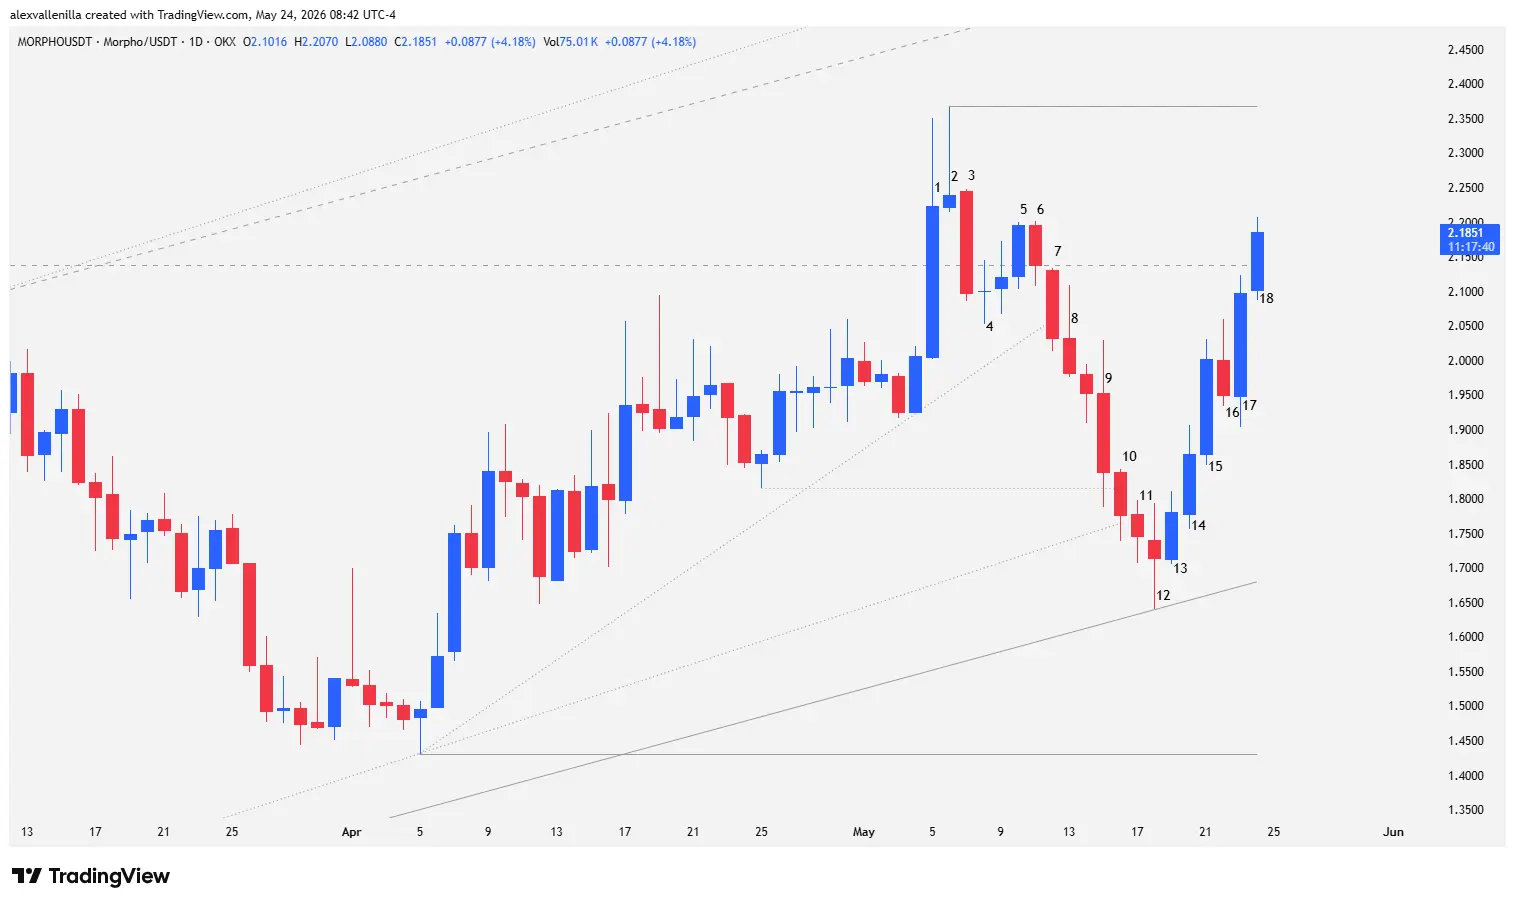
The MORPHO token currently trades at $2.1851, printing a partial gain of 4.18% during the latest session. Buyers are regaining market control after a deep but orderly correction, successfully piercing the structural resistance at $2.1381 once again. This move invalidates previous selling pressure and confirms the resilience of the primary ascending channel, now adjusted to 107 bars. Price action suggests that institutional order flow is absorbing available supply, setting the stage to challenge previous medium-term highs.
The Macro Chart Context
The key resistance at $2.1381 is not a random level; this geometric point coincides with a relevant high from the previous bearish trend that spanned 176 bars. A sustained breakout of this technical level acts as a macro catalyst that validates the transition toward a medium- to long-term bull cycle.
Under Price Action theory, breaching this threshold triggers a “Spike and Channel” pattern, transforming the old resistance into a magnetic support pivot. This scenario naturally projects the price toward the absolute high of the previous bearish cycle, located at $2.8593.
Price Action Breakdown: Bar-by-Bar Battle
Initial Momentum and the Exhaustion Trap (Bars 1 to 4)
Bar 1: A wide-range bullish candle with a convincing 10.78% surge. Being a “shaved bottom” bar from its open, it demonstrates absolute buying conviction from the first minute. It manages to close above the $2.1381 resistance, although the upper wick absorbs nearly 30% of the total range, revealing profit-taking and aggressive liquidations. The low respects the 37-bar microchannel (second leg up).
Bar 2: A bullish-closing Pin Bar. Although it prints a higher high at $2.3678, the massive upper tail against a tiny body warns of buyer exhaustion. The price fails to test the upper boundary of the overall channel.
Bar 3: A strong response from supply. A solid bar that retraces 6.29%, pushing the price back below the technical pivot, closing at $2.1823, and proving that the buying side still lacks absolute control.
Bar 4: A Doji that halts the immediate bleeding. It reflects indecision, but the close remains submissive below the resistance.
Fake Breakout and Buyer Capitulation (Bars 5 to 8)
Bar 5: Bulls attempt to defend the 37-bar microchannel. They achieve a moderate break above $2.1381 but print a lower high relative to Bar 2.
Bar 6: Bearish counter-attack candle. The high matches that of Bar 5, forming a “Tweezers Top” reversal pattern at the ceiling of the 107-bar channel, triggering sell signals.
Bar 7: Bears take control with a solid 4.94% candle. The high and the close stay below $2.1381 with no significant overlap, breaking the trendline of the 37-bar microchannel.
Bar 8: Bearish continuity candle confirming the microchannel breakout. It acts as a high-probability Low 2 short setup bar. The subsequent bar triggers the short order by piercing its low.
The Deceleration Process and Structural Adjustment (Bars 9 to 12)
Bar 9: A bearish Outside Bar that increases volatility by piercing local support at $1.8157, a control zone that corresponded to the pause of the previous bullish leg.
Bar 10: Bearish continuity that breaks local support and pierces the ascending channel trendline (which up to that moment counted 99 bars).
Bar 11: Formally breaks the base of the channel but shows a narrow body. Order flow denotes clear deceleration: the body of Bar 11 is smaller than that of Bar 10, which is smaller than that of Bar 9. Bears lose traction in the deep support zone.
Bar 12: A wide-range Doji with extensive wicks on both ends. The shrinking body confirms selling climax and exhaustion. The low of this bar at $1.6407 redefines the structure, serving as the anchor to adjust the primary ascending channel to its current 107 bars.
Reversal and Climax Acceleration (Bars 13 to 18)
Bar 13: Structural reversal candle. It prints a Higher Low that validates the adjusted dynamic support of the channel and stops the drop before testing critical support at $1.4309.
Bar 14: Bullish candle confirming the market turn, closing above the high of Bar 13. It sets up a high-probability “High 2” buy pattern, posting a 4.79% advance.
Bar 15: Strong bullish expansion candle with a 7.33% gain. It breaks the high of Bar 14 and formally activates the High 2 buy triggers. Tiny wicks demonstrate high institutional quality, though the accelerating body pattern (Bar 15 > Bar 14 > Bar 13) warns of a climax that typically precedes minor pauses.
Bar 16: Bearish profit-taking attempt with a prominent upper wick, but the low respects 50% of Bar 15’s body, confirming supply weakness.
Bar 17: Bullish Outside Bar with a 7.56% gain. It completely invalidates Bar 16 and attracts fresh capital into the market.
Bar 18 (Current Session): At the time of writing, the price trades at $2.1851 (+4.18%). Bulls push forward and successfully pierce the $2.1381 resistance once again.
Market Projection and Technical Scenarios
The recent technical configuration is markedly superior in efficiency and speed when compared to the preceding correction (Bars 5 to 12). Current candles display clean order flow, free of excessive overlaps and featuring robust bodies, giving the probabilistic advantage to the buying side.
Bullish Scenario: If the daily close consolidates above $2.1381, the price will clear the path to challenge local resistance at $2.3678 (Bar 2 high). Clearing this latter level will open the door for an extension toward the upper band of the quantitative channel at $2.5932, targeting the technical magnet at $2.8593 as the final macro objective.
Bearish Scenario: If supply rejects the price in this zone again, bears will look for a defensive test of the dynamic support (channel base) currently sitting at $1.6795, or failing that, the static and structural support of Bar 12 at $1.6407.
Price action in MORPHO highlights classic institutional absorption at key support levels. The bears’ failure to keep the price below the modified channel and the speed of the current rebound prove that the underlying bullish structure remains intact and backed by renewed momentum.
Disclaimer: This analysis is presented solely for informational and educational purposes based on Price Action methodology. It does not constitute financial advice or investment suggestions. Crypto assets exhibit high volatility; perform your own due diligence.
Communications Professional. Crypto Enthusiast. Economic Journalist. Bitcoiner & Altcoiner.