

The price of Toncoin (TON) closes the trading session at $1.939, printing a solid 9.86% daily recovery. However, the short-term technical structure flashes warning signs for traders. Following a parabolic rally that lifted the asset out of an accumulation range, bears are enforcing a deep correction under the “sell the rally” narrative. The temporary loss of key support at $1.95 forces buyers to fight for structural control in an environment of high volatility and aggressive order flow.
Anatomy of the Correction: Price Nakes Market Psychology
TON’s recent price action perfectly illustrates how retail euphoria collides with institutional profit-taking. The initial breakout from the macro downtrend promised sustained expansion; however, order flow shifted drastically upon hitting advanced liquidity pools, dragging the price back to its structural origin levels.
Bulls are desperately trying to validate the “role reversal” theory (where old resistance flips into new support), but selling pressure on upward rallies keeps the bearish bias alive within the 20-bar microchannel. At the time of this report, supply and demand are fighting a crucial battle at the $2.00 psychological boundary.
Technical Analysis: Precision Reading of Price Action
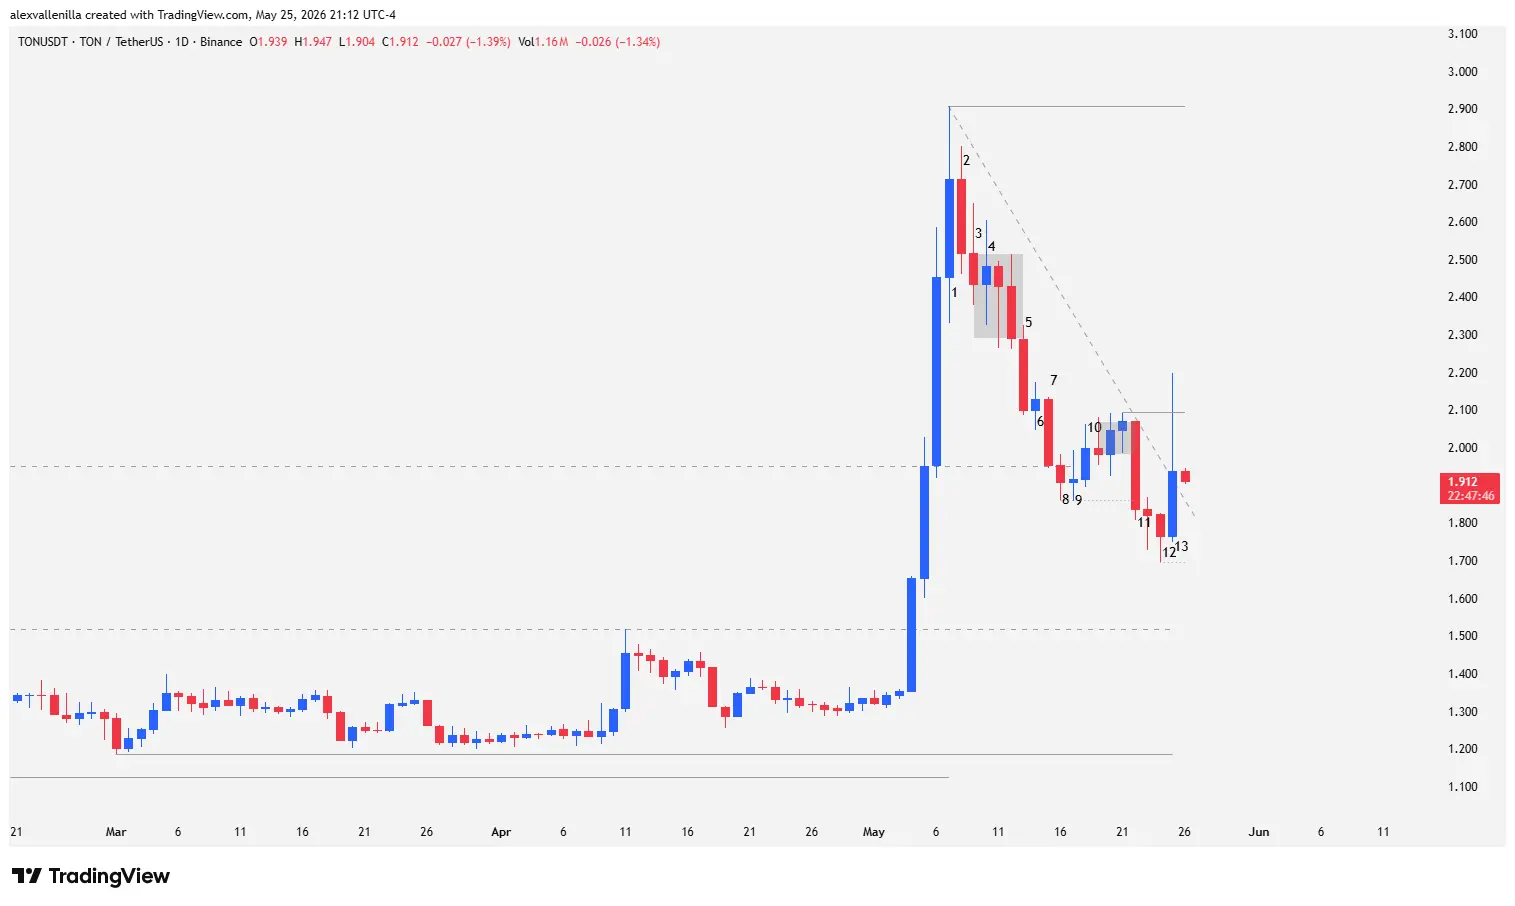
To understand where capital is moving, we must analyze the human interaction captured in the last 13 bars of the daily chart (1D).
Bar 1: This bullish bar crowns a powerful three-candle rally backed by institutional volume. Although it expands by 10.64%, its body size is smaller than its predecessors. It features a prominent upper wick and a sizeable lower tail, reducing its directional efficiency. Its high establishes resistance at $2.907, exhausting a measured move after breaking the previous range, while remaining far from the macro resistance at $3.749.
Bar 2: A bearish inside bar with a 7.26% range. It shows inefficiency due to tails on both ends, though it reduces volatility. Failing to test the high of Bar 1, it exposes the first symptom of buyer exhaustion.
Bar 3: Bears confirm the reversal by closing below the low of Bar 1. Structurally, this candle triggers a high-probability Low 2 short setup, validated by the context: a prior parabolic rally and the lingering background downtrend. The market executes the “sell the rally” maxim.
Bar 4: A small-bodied Doji with long tails that introduces total uncertainty. Bulls attempt a reversal to absorb supply, but the subsequent candle closes lower, confirming a failed reversal. Its low formally triggers the sell signal for the subsequent congestion structure.
Bar 5: A solid, clean, high-conviction bearish candle. It plummets the price by 8.25%, breaks the congestion, and validates the new bearish momentum.
Bar 6: A failed attempt by buyers to stop the bleeding, printing a tiny Doji that only traps more retail buyers.
Bar 7: A high-quality technical bearish candle. It drops 8.27% and accelerates the pullback to test critical support at $1.95 (the last relevant swing high of the original macro downtrend).
Bar 8: A small-bodied candle that manages to close marginally below the $1.95 support, temporarily flipping it into resistance. Its low establishes local support at $1.862.
Bar 9: A bullish Doji with almost no body that denies bearish continuity from Bar 8. It causes a failed breakout, and its low matches the previous one, printing a Tweezer Bottom pattern—a sign of supply exhaustion.
Bar 10: Prints bullish continuity, but with an alarming lack of momentum. Price moves up, but higher highs show severe exhaustion, stalling the market in compression over the next three bars.
Bar 11: Bears slam the table with a violent 11.35% bearish candle, shaved at the top (marubozu or open without a wick), showing absolute control of sell orders from the opening bell. Its close breaks the local support of Bar 8. The high of this candle serves as the anchor point for a new downtrend line drawn from the high of Bar 1. Furthermore, the previous candle established structural resistance at $2.095, which conflates as the control point for the 20-bar bearish channel. By losing $1.95, Bar 1 is officially labeled as a monumental bull trap. The risk now is a drop toward macro support at $1.518.
Bar 12: A small bearish candle with a lower tail the size of its body. The low pierces below Bar 11, but the close remains within its range. This shows that institutional money is starting to absorb short positions, defining local support at $1.697.
Bar 13: Aggressive reaction from buyers. They violently pierce the 20-bar downtrend line and challenge resistance at $2.095. However, inefficiency penalizes price action once again: a long upper wick reveals that bears are fiercely defending the structural pivot point of the microchannel.
The Verdict
Losing the $1.95 level shifted the psychology of the board. TON sits at a distributional crossroads: either bulls consolidate the close of Bar 13 above $2.095 to invalidate the bearish microchannel, or price will confirm the Bar 1 trap, opening the door to an orderly capitulation toward the $1.518 zone.
Disclaimer: This analysis is for strictly informational and educational purposes. It does not constitute financial advice or an investment recommendation. Cryptocurrencies exhibit high volatility; only risk capital you are willing to lose.

Communications Professional. Crypto Enthusiast. Economic Journalist. Bitcoiner & Altcoiner.


