

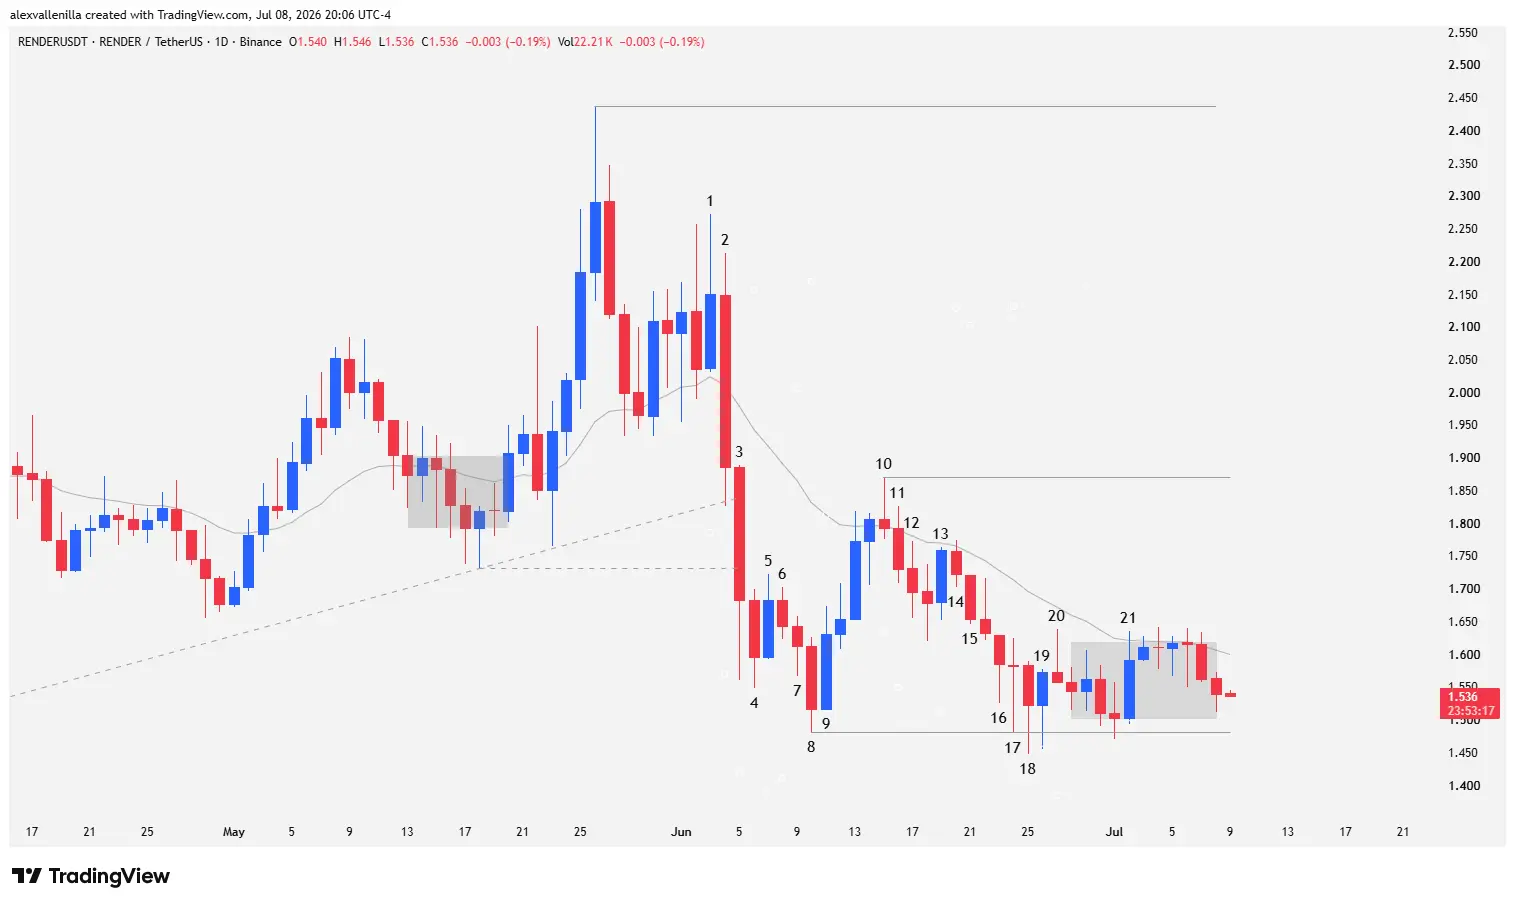
The cryptocurrency market is keeping a close eye on Render (RENDER). After losing a 119-bar secondary bullish channel that attempted to reverse the macro bearish structure, the crypto asset is trading under intense selling pressure. The price capitulated from its local resistance at $2.43, and following a series of bull traps, bears dragged the price below the 20-period exponential moving average (20 EMA). Currently, price action is compressing around critical support at $1.48, carving out a technical pattern that promises an imminent resolution for Web3 and AI ecosystem enthusiasts.
Anatomy of a Market Trap: RENDER’s Macro Pivot
RENDER’s current narrative demonstrates how crowd psychology clashes with institutional orders. Buyers structured a counter-trend channel for 119 days, aiming to breach major resistance at $2.71, the most relevant zone of control for the primary downtrend. However, the market executed a perfect trap. Failing to even test $2.71, the dominant (bearish) order flow absorbed the demand, validating the classic “sell the rally” strategy.
Despite the notable correction, the macro outlook exhibits a subtle accumulation signal: RENDER has stopped printing lower lows on the daily (1D) timeframe. Historical support at $1.18 has withstood the sellers’ onslaught for 201 bars, and the establishment of a higher intermediate floor at $1.48 suggests that strong hands are slowing the bleeding, looking to build a solid medium-term base.
Price Action Technical Analysis
Bars 1 to 3 (Rejection and Loss of Momentum): Bar 1 exposes the bullish capitulation by printing a lower high below $2.43. Its extensive upper wick confirms that bears completely absorbed the available demand. Immediately after, Bar 2 prints a strong bearish candle that pierces the previous low and pushes the price back below the 20 EMA. Bar 3 liquidates the secondary channel and breaks local support at $1.73, leaving a lower wick that denotes the first attempts to absorb supply.
Bars 4 to 8 (Deceleration and Reversal Failure): Bears lose traction on Bar 4, whose small body remains completely overlapped within the range of the preceding bar. Although Bar 5 attempts a bullish reversal, Bar 6 (a bearish closing inside bar) and Bar 7 confirm the failure of that move. The pressure pushes the price down on Bar 8 to set a new local support at $1.48, holding firmly above macro support at $1.18.
Bars 9 to 12 (The High-Probability Low 2 Pattern): Bar 9 executes a solid bullish impulse that clears the 20 EMA, but the joy is short-lived. Bar 10 emerges as a pin bar with a massive upper wick, invalidating the breakout and establishing local resistance at $1.87. Following the bearish confirmation of Bar 11, Bar 12 sets up a high-probability Low 2 short setup below the 20 EMA. The breakout of its low aggressively triggers sell order flow.
Bars 13 to 16 (Stop Hunting and Capitulation): Bulls try to react on Bar 13, but Bar 14 negates the move. This failed reversal traps early buyers; Bar 15 breaks previous lows, cascading market stop losses and accelerating the drop, which begins to stall on Bar 16 through absorption at the lows.
Bars 17 to 21 (Descending Triangle Compression): Bars 17, 18, and 19 (the latter being a pin bar inside bar) repeatedly defend the $1.48 level with long lower wicks, completing a two-legged bearish move from bar 10. Nonetheless, the bullish counterattack fails on Bar 20, which closes with a sharp upper wick. From there, price enters a micro congestion range (clearly seen on Bar 21), compressing lower highs against the $1.48 floor and shaping a classic descending triangle.
Market Outlook: Which Way Will RENDER Break?
The current scenario demands strategic patience. RENDER is trapped in a volatility squeeze zone within the micro-range. For bulls to regain true control of the structure, defending $1.48 is not enough; price must break above the 20 EMA and clear successive resistances at $1.87 and $2.43.
Conversely, if bearish order flow cleanly breaks the $1.48 support, latent liquidity will drag the price back to macro support at $1.18. At this technical juncture, the market remains on standby for the definitive volume that will break this compression pattern.
Disclaimer: This analysis is issued exclusively for informational and educational purposes through the interpretation of price action. It does not constitute, under any circumstances, financial advice, an investment recommendation, or an invitation to trade digital assets. Crypto assets exhibit high volatility; only risk capital you are willing to lose.

Communications Professional. Crypto Enthusiast. Economic Journalist. Bitcoiner & Altcoiner.


