

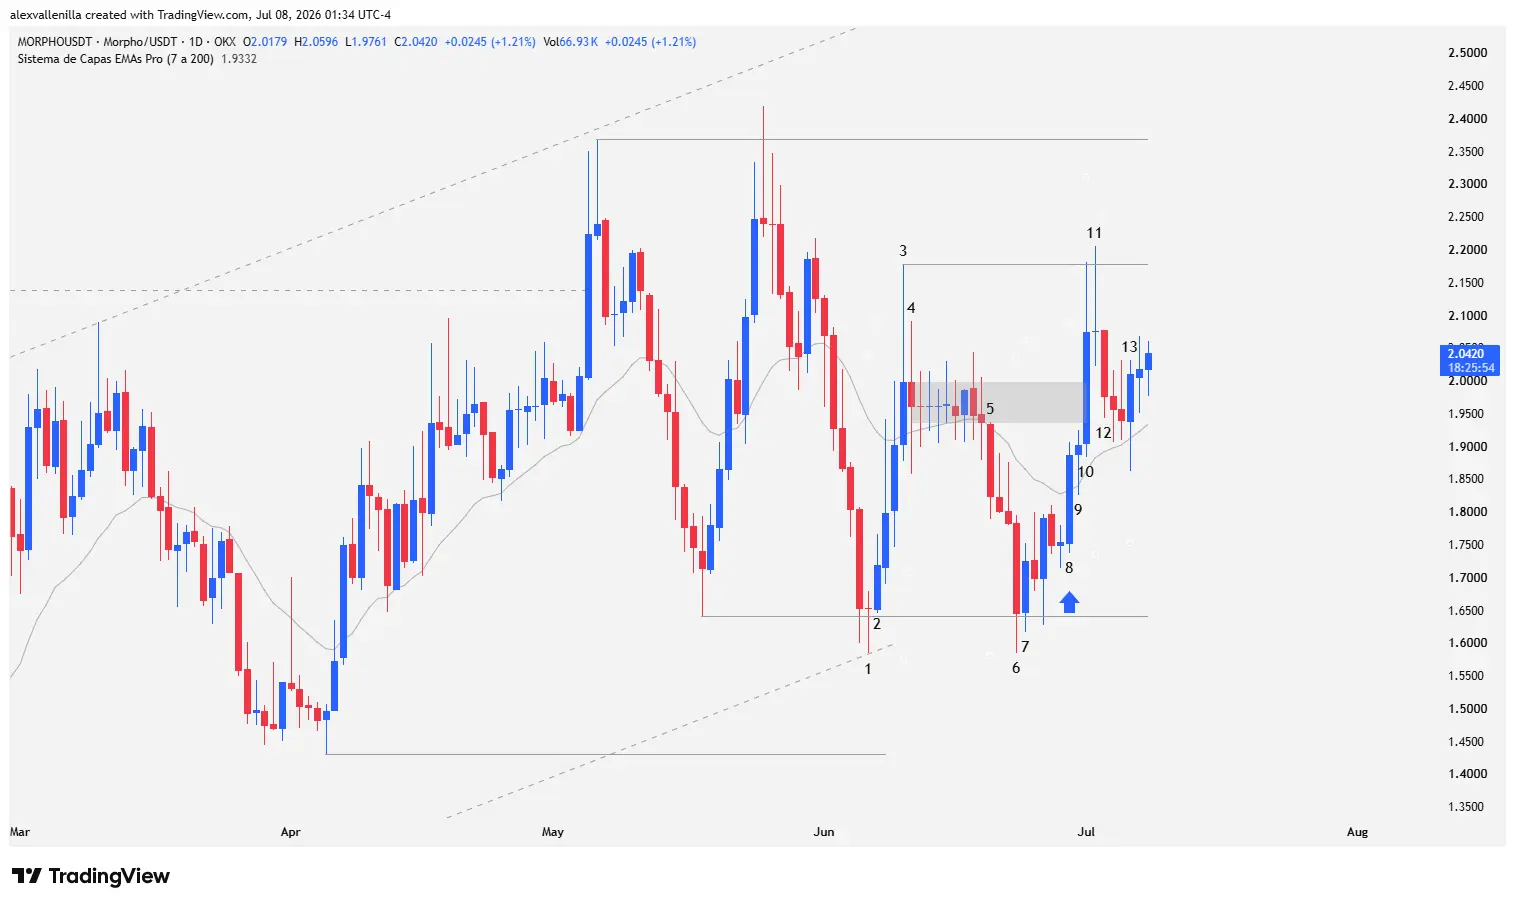
The MORPHO token enters a critical macro consolidation phase after completing a full two-leg bullish cycle over 123 sessions. Buyers’ inability to sustain $2.36 opens up a sideways range scenario between key support at $1.64 and local resistance at $2.17. This change in behavior halts the previous trend and triggers a battle for liquidity, where smart money actively defends positions against retail capitulation.
The End of the Two-Leg Cycle and Transition to a Trading Range
MORPHO price action paints a textbook technical transition. Following a prolonged uptrend that topped out at $2.36, the market completed its two-leg cycle and began to show exhaustion. When price loses its higher-high structure, liquidity flows toward the extremes, converting a trending market into a fairly wide trading range.
Institutional participants now use this environment to absorb floating orders, validating the $1.64 zone as a high-demand psychological floor—already tested three times—while supply blocks any advance at the upper boundary.
Technical Analysis: Price Action Breakdown
The bar-by-bar behavior on the daily (1D) timeframe perfectly describes supply and demand psychology:
The $1.64 Floor and the First Impulse
Bar 1: After a violent bearish climax bar, a doji appears. Although sellers pierce the $1.64 support, they fail to close below it or the previous session. Selling pressure grinds to a halt.
Bar 2: This bullish close bar triggers an immediate reversal. Its low misses testing the support, instantly trapping late bears from Bar 1 and confirming $1.64 as a buying zone. The two subsequent sessions inject high volatility with long wicks in both directions, signaling a fierce battle for control.
Bar 3: Bulls take the initiative and reclaim the 20-period EMA. However, the massive upper wick of this pinbar reveals that sellers are absorbing demand through profit-taking. Price capitulates before testing $2.36, establishing local resistance at $2.17.
Congestion, Capitulation, and the Bear Trap
Bar 4: Bears attempt to correct but fail as they cannot close below the 20 EMA or the low of Bar 3. Wicks on both ends give way to an eight-session micro-congestion range with virtually non-existent bodies.
Bar 5: Formally breaks down from this congestion pattern. Bears temporarily take control of the intraday bias.
Bar 6: A wide-range bearish bar that mimics a market capitulation. Sellers attack $1.64 for the second time but only achieve a momentary piercing. By closing above support, they execute a failed breakout pattern.
Bar 7: Acts as a bullish inside bar. By freezing bearish continuity, it sets the stage for a price reversal.
Institutional Intervention and Testing the Upper Range
Bar 8: After an exchange of naked bars, this strong conviction bar breaks to the upside and reclaims the 20 EMA. Smart money and institutions step into the market to defend $1.64, punishing the bears’ second failed attempt. Theory highlights that when the market fails twice at a target, it tends to aggressively seek the opposite extreme.
Bar 9 and 10: Confirm the bullish breakout. Bar 10 invalidates the previous congestion range, triggers the stop losses of the Bar 5 sellers, and its high directly tests the $2.17 level from Bar 3.
Bar 11: Buyers attempt to breach $2.17, but supply responds by printing a doji with a long upper wick. The piercing without a close denotes the exhaustion of the buying pressure that started at Bar 7.
Bar 12: Bears trigger a retracement by closing below the previous low, though with a smaller range than the institutional bars. The two subsequent sessions show small bodies resting on the 20 EMA.
Bar 13: Bears strike at the 20 EMA, but a prominent lower wick demonstrates that buyers are defending the dynamic moving average, winning the battle by the closing bell.
Market Outlook
MORPHO sits within a mature sideways structure. Demand resilience at the 20 EMA and the triple rejection at $1.64 suggest that smart money is actively accumulating the asset. However, price needs to cleanly break and consolidate above $2.17 to resume its macro bullish structure and target the remaining liquidity at $2.36. Until this happens, range traders will maintain control over the order flow.
Disclaimer: This analysis is presented for informational and educational purposes only. It does not constitute financial advice, investment recommendations, or an offer to buy or sell digital assets.

Communications Professional. Crypto Enthusiast. Economic Journalist. Bitcoiner & Altcoiner.


