

The digital finance market is witnessing a solid awakening for Just (JST) during 2026. The native cryptocurrency of the TRON network’s lending governance platform posts an impressive 130.59% year-to-date return, backed by a 180.73% year-over-year growth. Right now, buyers actively press market structure on the daily (1D) chart, attempting to validate a macro two-leg upward pattern that could project the price toward levels not seen in over 1,500 sessions.
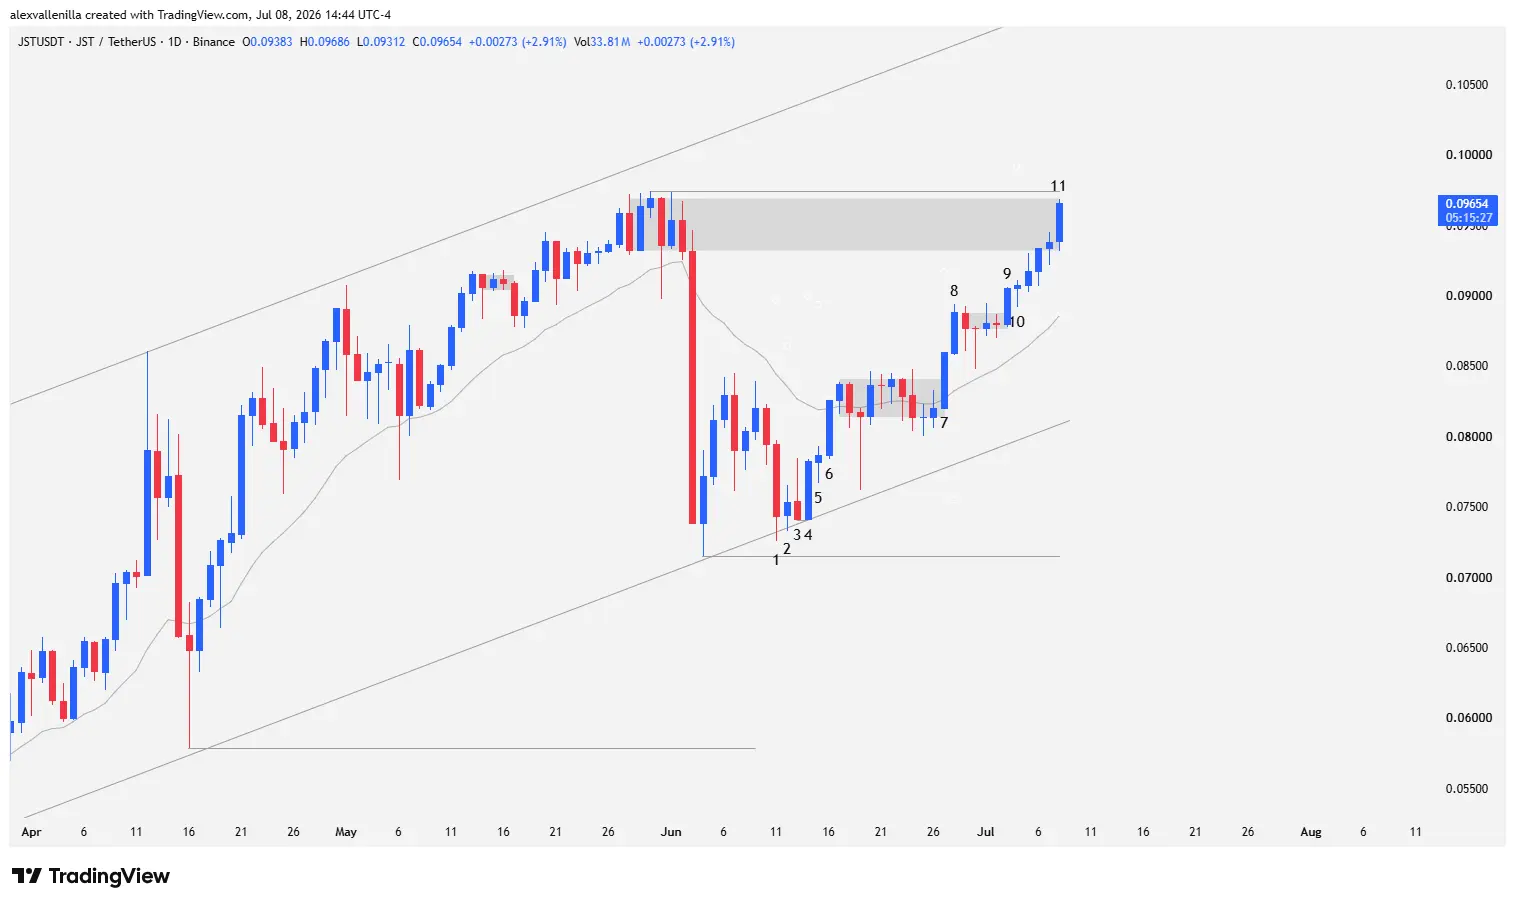
Macro Structure: The Power of the 146-Bar Ascending Channel
JST price action moves with surgical precision inside a medium-term ascending channel accumulating 146 bars. Following a violent capitulation from the top of the trend—driven by institutional profit-taking—the price found a solid floor without compromising the primary structure.
Bears attempted to force a structural reversal, but buy order flow successfully defended key support at $0.0715. This zone acts as the macro fulcrum of the current trend. If the current momentum manages to clear the noise from the immediate resistance, the market will execute a measured move whose projection points directly to historical resistance at $0.1174, a technical target the price has not tested for 1,563 sessions.
Price Action Technical Analysis: Bar-by-Bar Breakdown
To understand trader psychology and the battle between supply and demand, we break down the narrative of the last 11 bars on the daily chart in detail:
Bar 1: Bears aggressively attack the lower boundary of the ascending channel. Although they momentarily pierce the trendline, the bar closes inside the channel. Supply fails to test structural support at $0.0715, revealing an early lack of selling pressure.
Bar 2: This inside bar halts the bearish advance in its tracks. Buyers defend the ground and post a higher low than the previous bar, closing clearly above the channel trendline.
Bar 3: Bulls take the initiative, but supply pressure at the top generates a pin bar with a notable upper wick. Despite the rejection, bears fail to breach the previous low, consolidating a new higher low.
Bar 4: A completely bullish session that builds a key structure despite printing a narrow range below the institutional average. Its low matches the low of Bar 3, forming a Tweezer Bottom pattern that negates bearish intentions.
Bar 5: Buyers clear the high of Bar 5 and confirm the dynamic bounce. Smart money completely absorbs the previous capitulation, proving that the drop lacked structural continuity.
Bar 6: Momentum breaks above the 20-period Exponential Moving Average (20 EMA). Following the breakout, the price temporarily enters a tight congestion micro-range with overlapping bars directly on the 20 EMA line, building liquidity.
Bar 7: A wide-range bullish bar, completely “shaved” (marubozu-like, with no noticeable wicks on its ends). Smart money trades with strong conviction from open to close, violently breaking out of the previous congestion zone.
Bar 8: This bar confirms the breakout and validates the start of the second upward leg (Leg 2) of the structure. The first leg originated at the low of Bar 1, rested in the micro-range, and now projects its target proportionally. Subsequently, the price strings together four bars of lateral breathing room, staying strictly above the 20 EMA.
Bar 9: Bulls resume the attack with another strong conviction candle, showing almost no lower wick and a close near the high, breaking the second price pause.
Bar 10: Confirms the breakout of the latest congestion. From here, the market chains three expansion bars that push the price into a legacy bearish order block.
Bar 11 (Developing Bar): Price trades right in the previous resistance zone, corresponding to the last high of the primary uptrend. As it is the current day’s session, it has not closed yet, and its high fails to touch key resistance at $0.0974. This zone currently acts as a liquidity magnet.
Technical Scenarios for the Upcoming Sessions
The two-leg upward cycle might be reaching maturity on Bar 11. The outcome of the current session will determine JST’s direction for the end of the quarter:
Bullish Scenario
If buy order flow pierces resistance at $0.0974, the price will highly likely target the top of the ascending channel. A clean breakout will invalidate historical order blocks and open the doors to reclaim $0.1174.
Bearish Scenario
If bulls show exhaustion at this ceiling and the price suffers a drastic rejection, we will enter a healthy correction phase. In this case, trend integrity will depend on defending key supports: first the 20 EMA at $0.0885, followed by the bullish trendline at $0.0811, and finally structural support at $0.0715.
Disclaimer: The analysis presented is for informational and educational purposes only, based on price action. It does not constitute financial advice or an invitation to invest in crypto assets.

Communications Professional. Crypto Enthusiast. Economic Journalist. Bitcoiner & Altcoiner.


