

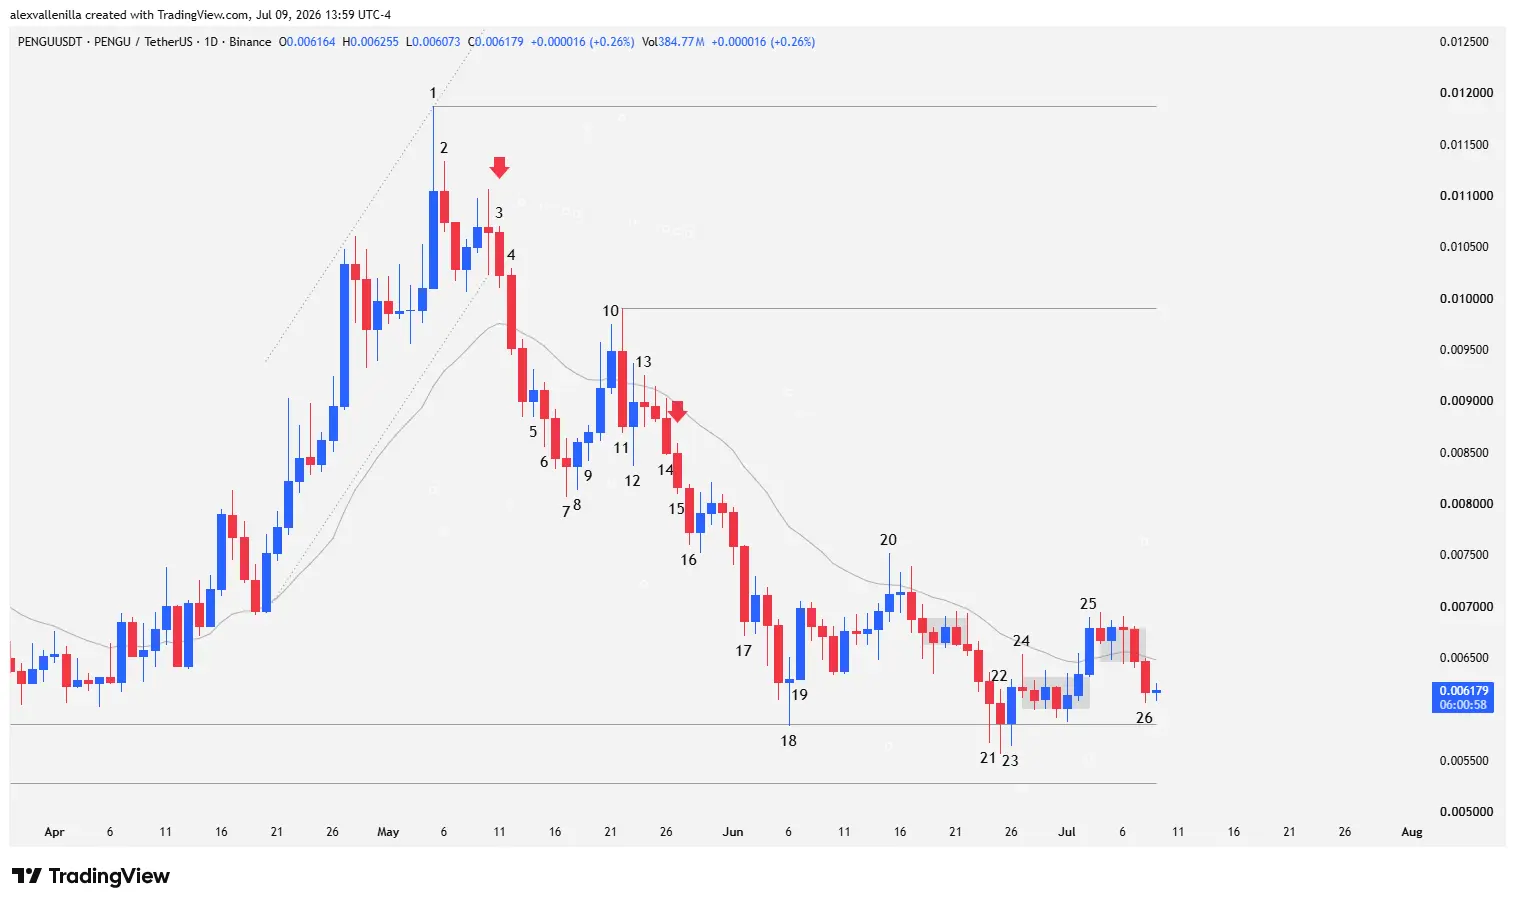
The digital finance market is witnessing a masterclass in crowd psychology and price action on the PENGU daily chart. Following a 20-bar rally that sparked optimism among retail traders, the asset failed to validate a macro market structure shift, triggering an aggressive bull trap. The subsequent institutional sell-off dragged price down via a perfect two-legged measured move. Currently, price is compressing volatility against a critical floor, carving out a structure that will define the medium-term future for this crypto asset.
The Rally Trap: Resistance and Absorption
The upside reversal attempt ended abruptly as it collided with the reality of the primary trend. Buyers pushed price higher with strong momentum, but the prior technical structure imposed its law of supply and demand.
Bar 1 to Bar 4: The Origin of the Deception
Bar 1 established local resistance at $0.0118, but this move lacked the necessary strength to reach $0.0138, the level representing the last relevant lower high of the prior downtrend and the true boundary for a genuine structure shift. By printing above the 20-period exponential moving average (20 EMA) without altering the primary trend, Bar 1 operated as an EMA gap bar.
Bar 2, a bearish inside candle, confirmed the buying climax trap by sporting a massive upper wick and denying any bullish continuity. Institutional traders executed the classic strategy of selling the rally. Confirmation of the reversal came with Bar 3, which broke below the floor of a 20-bar micro-channel and set up a high-probability Low 2 short entry. Finally, Bar 4 validated the move by closing below the prior candle’s low and the 20 EMA, burying any countertrend momentum.
Bar 5 to Bar 10: Battle at the Floor and Rebound Attempt
Bearish momentum hit temporary friction at Bar 5, whose low matched the previous session to form a tweezers bottom pattern. However, sellers absorbed this attempt; Bar 6 pierced this double bottom, attracting more supply, though a lower wick matching its body size revealed the appearance of the first buy orders.
Following the indecision of Bar 7 (a doji closing above the prior low, reflecting a loss of bearish momentum) and the inside bar consolidation of Bar 8, Bar 9 confirmed a bounce that Bar 10 extended above the 20 EMA in a fresh attempt to regain the initiative.
The Second Bearish Leg: Volatilidad and Capitulation
The bears’ response to the retail crowd’s bold move was immediate and aggressive, unleashing volatility that wiped out leveraged positions.
Bar 11 to Bar 17: The Liquidity Sweep
Bar 11 crushed optimism by printing as a massive outside candle that trapped early buyers from the previous session. This bar closed below the low of Bar 10, pushing price back into bearish territory below the 20 EMA and locking in a new lower high relative to Bar 1. Although Bar 12 tried to stop the bleeding with long wicks on both ends, the inability to close above the 20 EMA and the subsequent inside consolidation of Bar 13 marked a new reversal failure that attracted more sellers.
The bearish resumption materialized on Bar 14, followed by Bar 15, a high-probability Low 2 sell setup. This candle triggered the stop-losses of the bulls who sought support at Bar 12, providing the necessary fuel to complete a perfect two-legged measured move from the Bar 1 high. Activation triggered on Bar 16, giving way to Bar 17, a high-conviction, climactic institutional range candle that marked the final capitulation of the move.
Compression at Support: Accumulation or Collapse?
Price has entered an extreme confinement phase where buyers defend a historical red line while selling pressure narrows room for maneuver.
Bar 18 to Bar 26: Institutional Defense
Bar 18 functioned as a key pinbar whose low tested historical support at $0.0058, a floor respected for the last 148 bars. The institutional capital response consolidated on Bar 19, a shaved-bottom candle that took out prior highs, initiating an accumulation phase. Bar 20 temporarily pierced the 20 EMA, but its inability to close above it triggered a five-bar congestion.
In recent sessions, bears attempted to break below $0.0058 via Bars 21 and 22, but both closed above the level, leaving thick lower tails. Bar 23 confirmed the defense of this wall with a buying pressure pattern. Although Bar 24 marked a pullback, it set another lower high which, when contrasted with the horizontal support, defines a clear descending triangle. Bar 25 managed to break above the 20 EMA, but lack of follow-through resulted in a flat micro-range that Bar 26 broke to the downside, though without the strength to retest the floor.
Macro Perspective on Order Flow
Price action across the last 148-bar block reveals a top-tier analytical detail: the asset has stopped printing new macro lower lows. This loss of bearish momentum suggests that the primary selling structure is showing signs of structural exhaustion, transforming the current congestion phase into a probable whale re-accumulation zone.
To validate a definitive medium-to-long-term trend reversal, price action must first clear the Bar 10 high at $0.0099, and subsequently break resistance at Bar 1 at $0.0118. Should the $0.0058 support fail, institutional order flow will hunt for residual liquidity at the next critical support level located at $0.0052.
Disclaimer: This analysis is issued exclusively for informational and educational purposes based on Price Action methodology. It does not constitute financial advice, an investment recommendation, or an offer to buy or sell crypto assets. Digital markets exhibit extreme volatility; trade at your own risk and capital analysis.

Communications Professional. Crypto Enthusiast. Economic Journalist. Bitcoiner & Altcoiner.


