

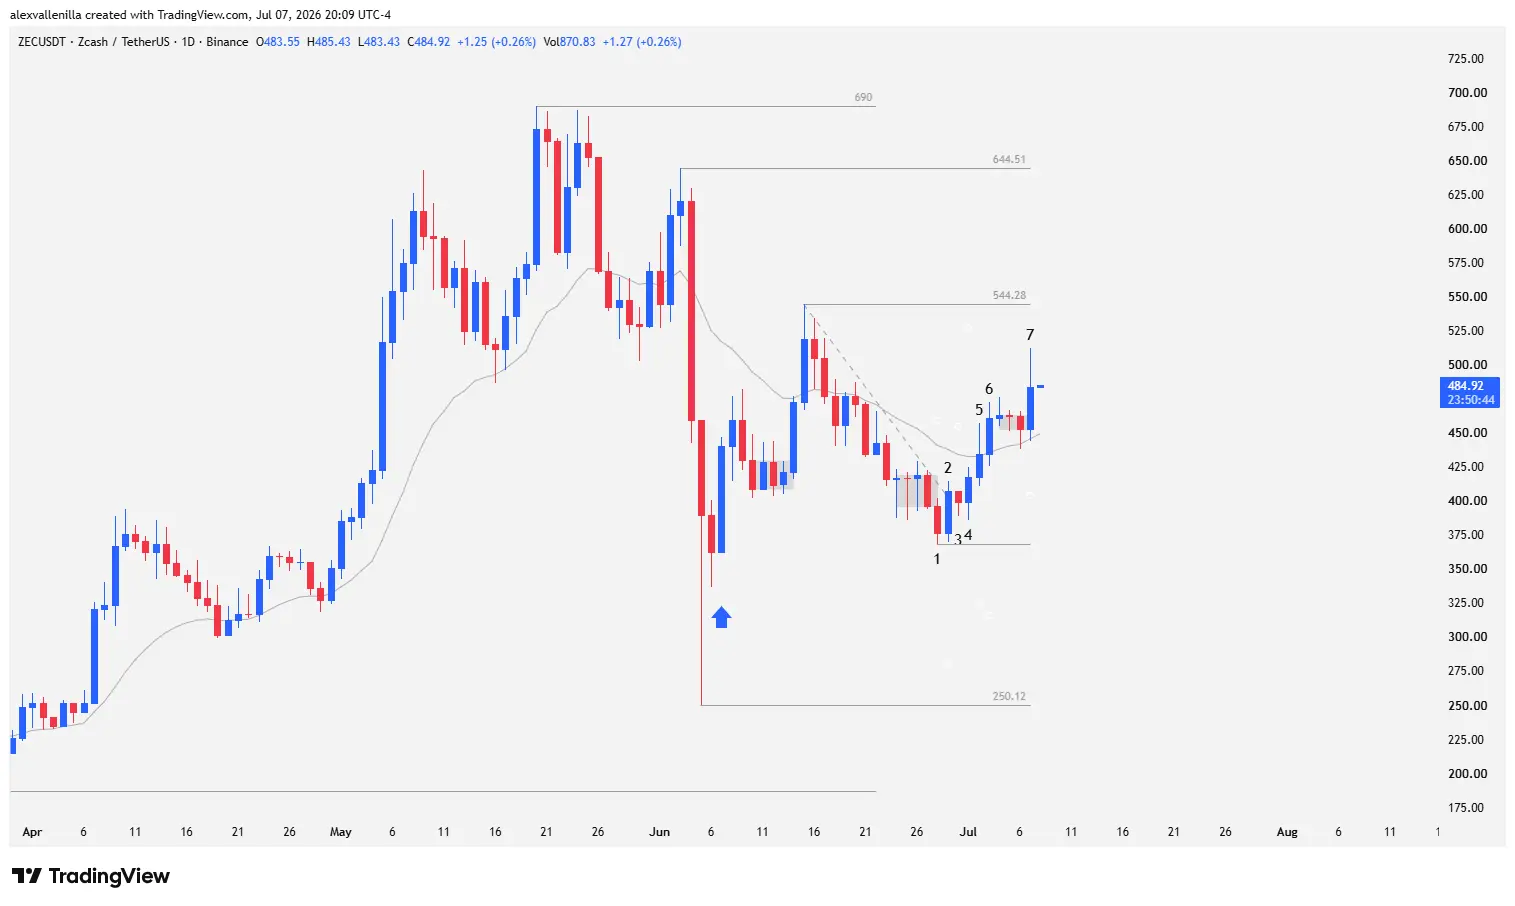
The privacy coin market is reclaiming the spotlight. Following a severe short-term correction that spanned 14 sessions, Zcash (ZEC) kicked off a solid recovery structure on its daily chart. Supply’s inability to pierce critical support levels triggered a short squeeze, driving the price up from $368.03. Boasting a 1,150.09% cumulative return over the past year and an impressive 49.74% advance in the last three months, the asset erases early 2026 uncertainty (where it posts a slight 5.45% dip) and sets its sights on key institutional resistance.
The Resurgence of ZEC: Structure and Order Flow Psychology
Zcash’s recent price action proves that order flow and exposed liquidity determine price direction far more efficiently than any lagging indicator. The preceding 14-bar correction planted a bearish bias among retail traders, inducing short positions to sell at the bottom of a consolidation structure.
However, institutional buyers passively absorbed the massive supply, aggressively defending the zone above the macro low of $250.12. By smashing the stop losses of late sellers, ZEC generated the necessary fuel to flip the immediate bias, building structured bullish momentum that seeks to validate the primary long-term trend.
Price Action Analysis: Bar by Bar (1D Chart)
Bar 1: The Initial Bear Trap
Sellers attempt to extend the previous correction by breaking the base of a congestion pattern. However, the session closes without continuation and prints a higher low relative to $250.12, validating $368.03 as concrete support.
Bar 2: The Failure Climax (Bear Trap)
A wide-range candle with a bullish close completely invalidates the previous session’s strength. By breaking above the high of Bar 1, the price confirms a bearish breakout failure. Sellers are trapped, and the order flow shifts sharply in favor of demand.
Bar 3: Strategic Pause
This session prints as an inside bar. This minor pattern reflects a healthy consolidation where bears are unable to press the price lower, limiting the pullback to an extremely tight range.
Bar 4: Bullish Control Confirmed
The price breaks decisively above the high of Bar 3. This move cancels out any hint of a correction and resumes the bullish momentum initiated in Bar 2.
Bar 5: Battle at the Moving Average
Buyers manage to pierce the 20-period exponential moving average (EMA20). Despite the advance, the session closes leaving a noticeable upper wick or tail, showing that supply still offers resistance in dynamic liquidity zones.
Bar 6: Institutional Conquest of the EMA20
Bar 6 buries the previous day’s doubts convincingly. The price closes above the high of Bar 5, placing almost its entire real body above the EMA20 and confirming the breakout. From this point, the price enters a brief three-candle pause.
Bar 7: High-Level Absorption
Buying pressure breaks the previous micro-congestion to the upside. However, the development of a long upper shadow shows that bears are actively defending territory before allowing a direct test of the critical $544.28 level.
Outlook: Technical Targets and Invalidation Zones
The measured move from the Bar 1 pivot suggests the development of a two-legged, balanced bullish structure, using the latest congestion zone as its central re-accumulation axis.
Bullish Scenario: If order flow maintains the pressure, the immediate target sits at the $544.28 resistance. A solid breakout above this level will swing the technical gates wide open to hunt for the next major liquidity pool at $644.51, formally resuming the macro uptrend.
Pullback Scenario: Should supply from Bar 7 force a minor correction, the price has two crucial safety nets. The dynamic support of the EMA20 at $449.24 will act as the first line of defense. If that fails, ultimate structural support remains at the Bar 1 lows at $368.03.
Analyst’s Note: Candle geometry indicates that institutions are accumulating on dips, clearing out leveraged market stops before targeting yearly highs.
Disclaimer: This analysis is presented for informational and educational purposes only. It does not constitute financial advice, an investment invitation, or a trading recommendation of any kind.

Communications Professional. Crypto Enthusiast. Economic Journalist. Bitcoiner & Altcoiner.


