

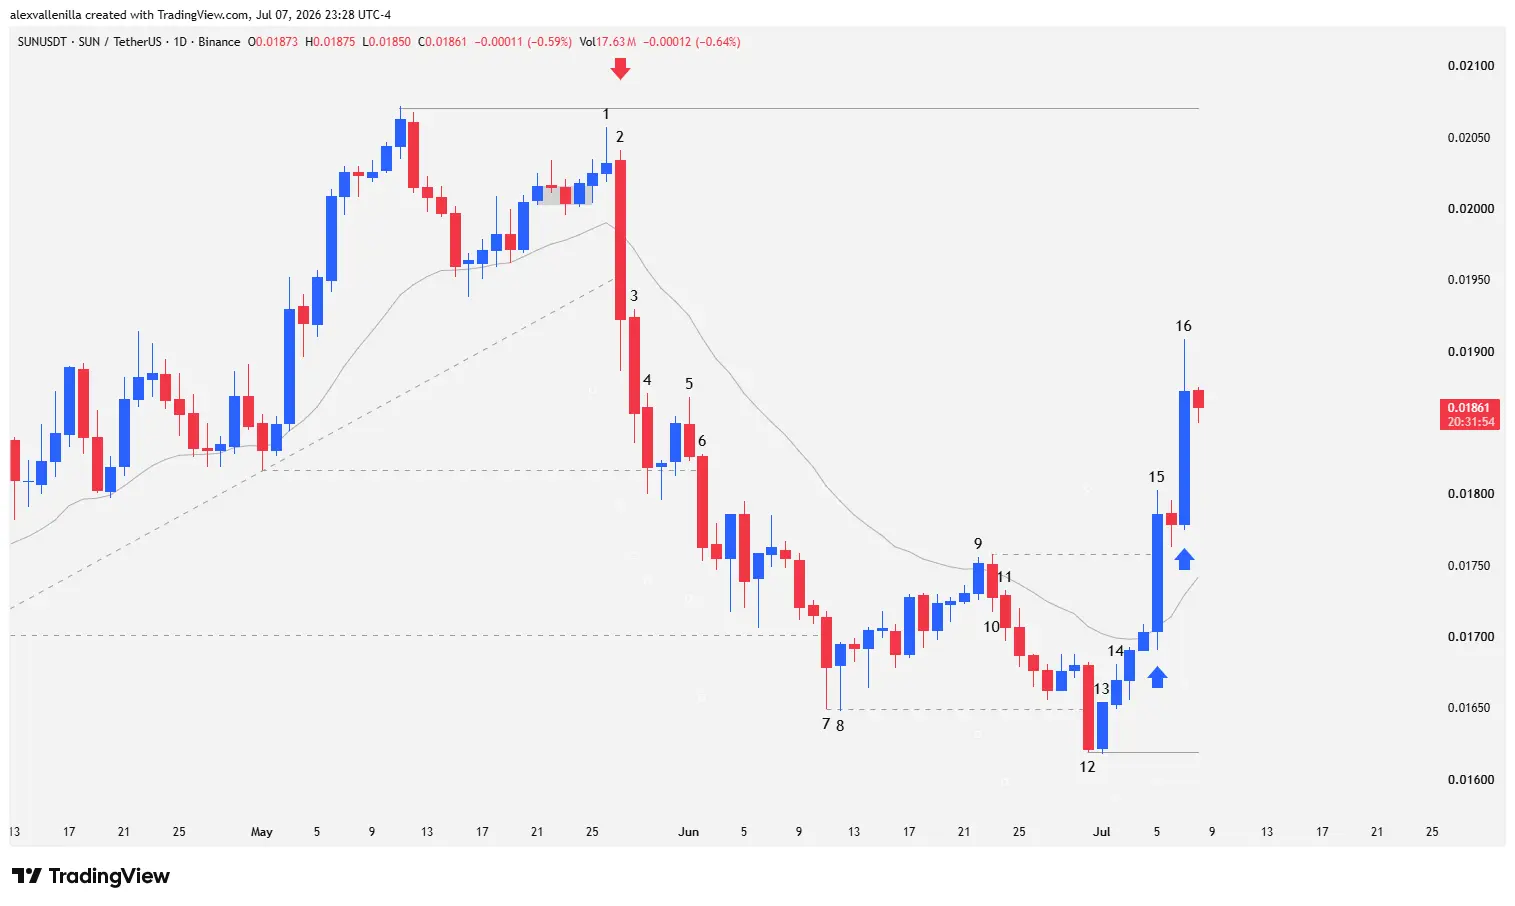
The digital finance market delivered a masterclass in mass psychology through the price action of the cryptocurrency SUN. After a prolonged upward impulse lasting 87 sessions, buyers capitulated following their inability to break the critical resistance at $0.0207. This momentum failure triggered an aggressive institutional sell-off that pierced key structural supports down to $0.0161. However, the subsequent absorption of supply in discount zones triggered a massive short squeeze, restoring control to the buyers and setting up a bullish reversal scenario with direct targets at the previous highs.
The Origin of the Crash: Top Trap and Channel Breakout
The structure of the digital asset SUN showed latent signs of fatigue following a medium-term ascending cycle. The demand’s inability to sustain high prices sounded alarms for institutional algorithms, transforming retail complacency into a systemic liquidation scenario.
The current price reflects a fierce battle for control of the order book, where institutional capital flow swept retail liquidity at both ends of the chart.
Technical Analysis: Price Action and Order Flow Reading
Phase 1: Loss of Momentum and Structural Break (Bars 1 to 6)
Bar 1: Buyers show the first sign of extreme weakness by failing to test the resistance zone at $0.0207, the high of a previous 87-bar impulse. The absence of demand freezes bullish momentum.
Bar 2: Bears take the initiative with a high-conviction bar. This move produces a violent breakout of the medium-term ascending channel line and the 20-period exponential moving average (EMA 20), while also breaching the last swing low. The bias shifts drastically to bearish.
Bar 3 and Bar 4: Institutional money provides continuity to the move. Although the price range decreases, Bar 4 slightly pierces the structural support at $0.181 (the opposing swing low of the previous trend).
Bar 5 and Bar 6: After a failed two-bar reversal attempt, sellers print Bar 6: a strong bearish conviction candle, completely shaved head (devoid of an upper wick). This proves that selling pressure dominated the order flow from the session open, definitively breaking below $0.181.
Phase 2: Liquidity Hunt and Climactic Capitulation (Bars 7 to 12)
Bar 7: Selling pressure breaks the key support at $0.0170 and hits a low of $0.164. However, a prominent lower wick reveals that smart money is starting to absorb the massive supply at discount prices.
Bar 8: A bullish Pinbar prints. Its extensive lower shadow validates a Tweezer Bottom reversal pattern as it matches the low of Bar 7, initiating a minor bounce.
Bar 9 and Bar 10: Retail buyers attempt a breakout above the EMA 20 with Bar 9, but the move lacks institutional volume. Bar 10 acts as a bearish engulfing bar, wiping out the bullish attempt.
Bar 11: Confirms the pullback, resuming downward pressure. However, the progressive shrinking of the candle bodies reveals seller exhaustion as they approach $0.0164.
Bar 12: Climactic capitulation occurs. Smart money flushes the order book with a bearish acceleration bar that breaks support and establishes a new low at $0.0161. Located at the base of a mature move, this Bar 12 is classified as a selling climax, a common precursor to macro reversals.
Phase 3: Institutional Reversal and Short Squeeze (Bars 13 to 16)
Bar 13: Bears fail to provide continuity to the climactic breakout. Bulls defend the zone and form a new Tweezer Bottom pattern at $0.0161, leaving Bar 12 trapped as a fakeout.
Bar 14: Closes strongly above the high of Bar 13, validating the reversal. Over the next two sessions, the price reclaims the EMA 20 and breaks above the high of Bar 12. By completely invalidating the capitulation candle, late sellers’ stop losses trigger automatically, accelerating the upward move.
Bar 15: A high-conviction bullish bar consolidates institutional dominance. It breaks and closes comfortably above the high of Bar 10, confirming the shift in order flow.
Bar 16: With virtually no lower wick, this candle demonstrates absolute buying pressure from the opening bell. Buyers defend the new support and point directly toward a retest of the major resistance at $0.0207.
Macroeconomic Outlook and Closing Thoughts
SUN’s behavior exposes the classic mechanics of order flow manipulation in crypto markets. What was initially perceived as an imminent collapse was actually a liquidity hunt orchestrated by institutional investors to accumulate assets in an optimal discount zone.
Currently, the bias points back to $0.0207. Should a healthy pullback occur, the EMA 20 (dynamic at $0.0174) and the climax low at $0.0161 will act as critical support zones, remaining comfortably above the macro invalidation level located at $0.0149.
Disclaimer: The information presented in this technical analysis is for educational and informational purposes only and does not constitute financial advice, investment recommendations, or an offer to buy or sell digital assets.

Communications Professional. Crypto Enthusiast. Economic Journalist. Bitcoiner & Altcoiner.


