

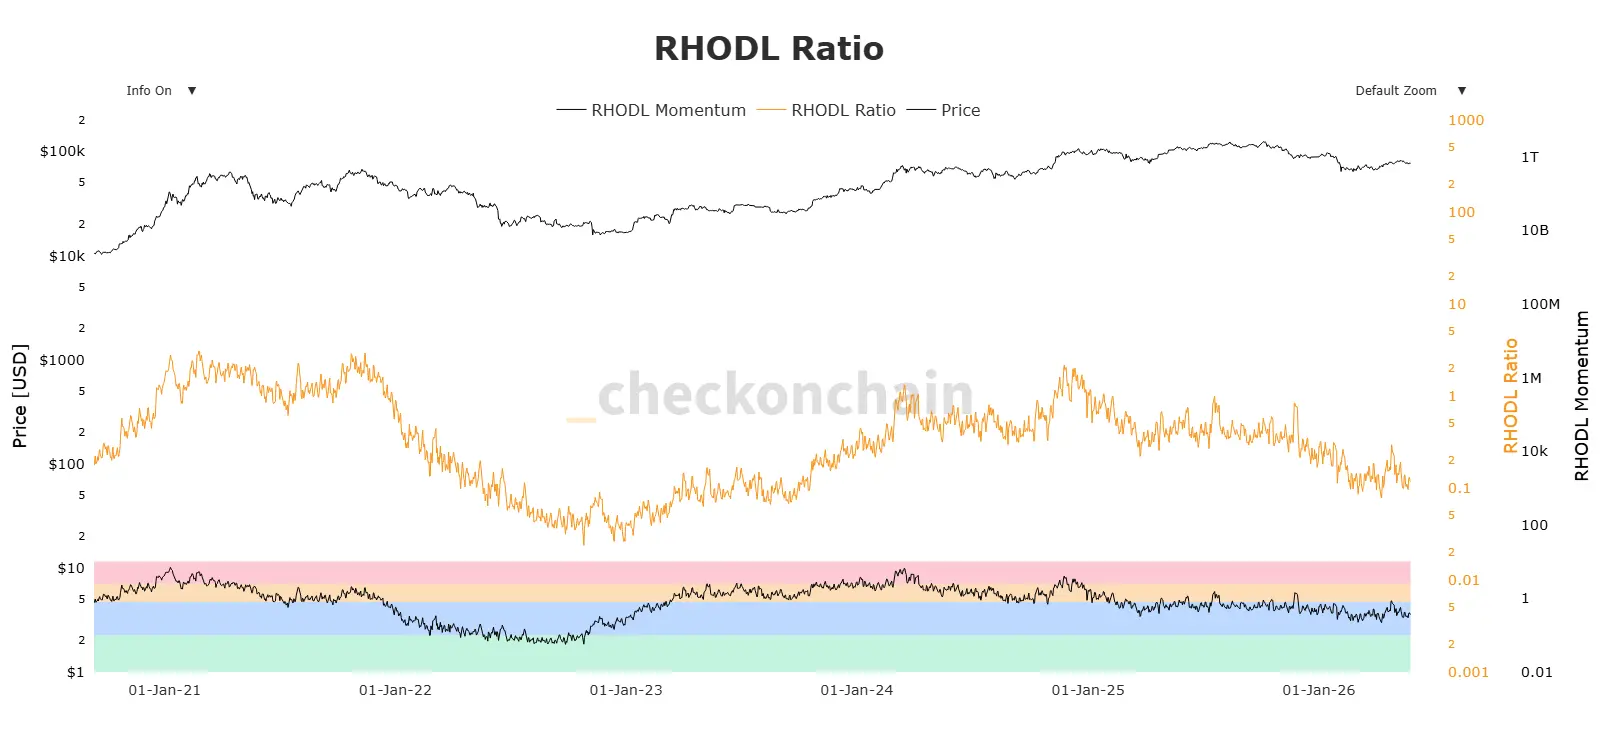
The Bitcoin network is sending clear signals of capitulation followed by accumulation. According to the latest on-chain data, the price of bitcoin trades today at $76,765.91, stabilizing after months of correction. The key RHODL Ratio indicator reached a value of 0.1173962, confirming that the market is in a macroeconomic “bottom” phase, where weak hands transfer their assets to institutional and long-term investors (HODLers).
On-Chain Analysis: HODLers’ Behavior vs. Price
To understand the current Bitcoin market structure, analyzing the trajectory of the RHODL Ratio in past cycles and its correlation with price action is essential:
The cycle top ($99,000.00): On November 24, 2024, the indicator touched a high of 2.165338. This reflected a saturation of coins held by short-term investors (speculators), coinciding with bitcoin’s all-time high price nearing six figures.
The drop and fakeout bounce ($75,000.00): On April 26, 2026, the ratio marked a local high of 0.294839. After failing to clear this technical and on-chain resistance level, the metric continued its descent, dragging the price down with it.
Historical capitulation zone: Currently, with a RHODL Ratio at 0.1173962, the indicator sits very close to the low recorded on April 10, 2026 (0.07780254)—levels not seen since September 2023, when the asset traded at just $26,000.00.
What Does This Mean for the Market’s Future?
In Bitcoin network terminology, a low RHODL Ratio indicates that on-chain wealth has shifted massively toward aged coins (investors unwilling to sell at these prices).
Despite the sharp decline since December 2025, the indicator seems to be cementing a solid floor by failing to break below the extreme low of April. The RHODL Momentum, sitting at 0.3685884, confirms that the velocity of value loss is halting abruptly. Historically, entering this “cold zone” (the lower green and blue bands on the chart) has been one of the most profitable buy signals for strategic investors before the start of a new bullish impulse.
Future Outlook
Price resilience above $76,000.00, combined with a RHODL Ratio at deep accumulation levels, suggests that selling pressure is exhausting. If history repeats itself, the transfer from speculative hands to strong hands over recent weeks will lay the groundwork for the crypto market’s next major bullish structure.
Disclaimer: This article is presented for informational and educational purposes only. It does not constitute financial, investment, or trading advice. Every investor must conduct their own research before making decisions in the crypto-asset market.

Communications Professional. Crypto Enthusiast. Economic Journalist. Bitcoiner & Altcoiner.


