

The digital asset market is experiencing crucial hours. PAX Gold (PAXG), the leading benchmark for tokenized gold, is undergoing a structural price contraction, posting a loss of 5.18% year-to-date in 2026 and a 13.09% decline over the last quarter. Despite this correction, the crypto asset maintains a solid year-over-year return of 23.79%.
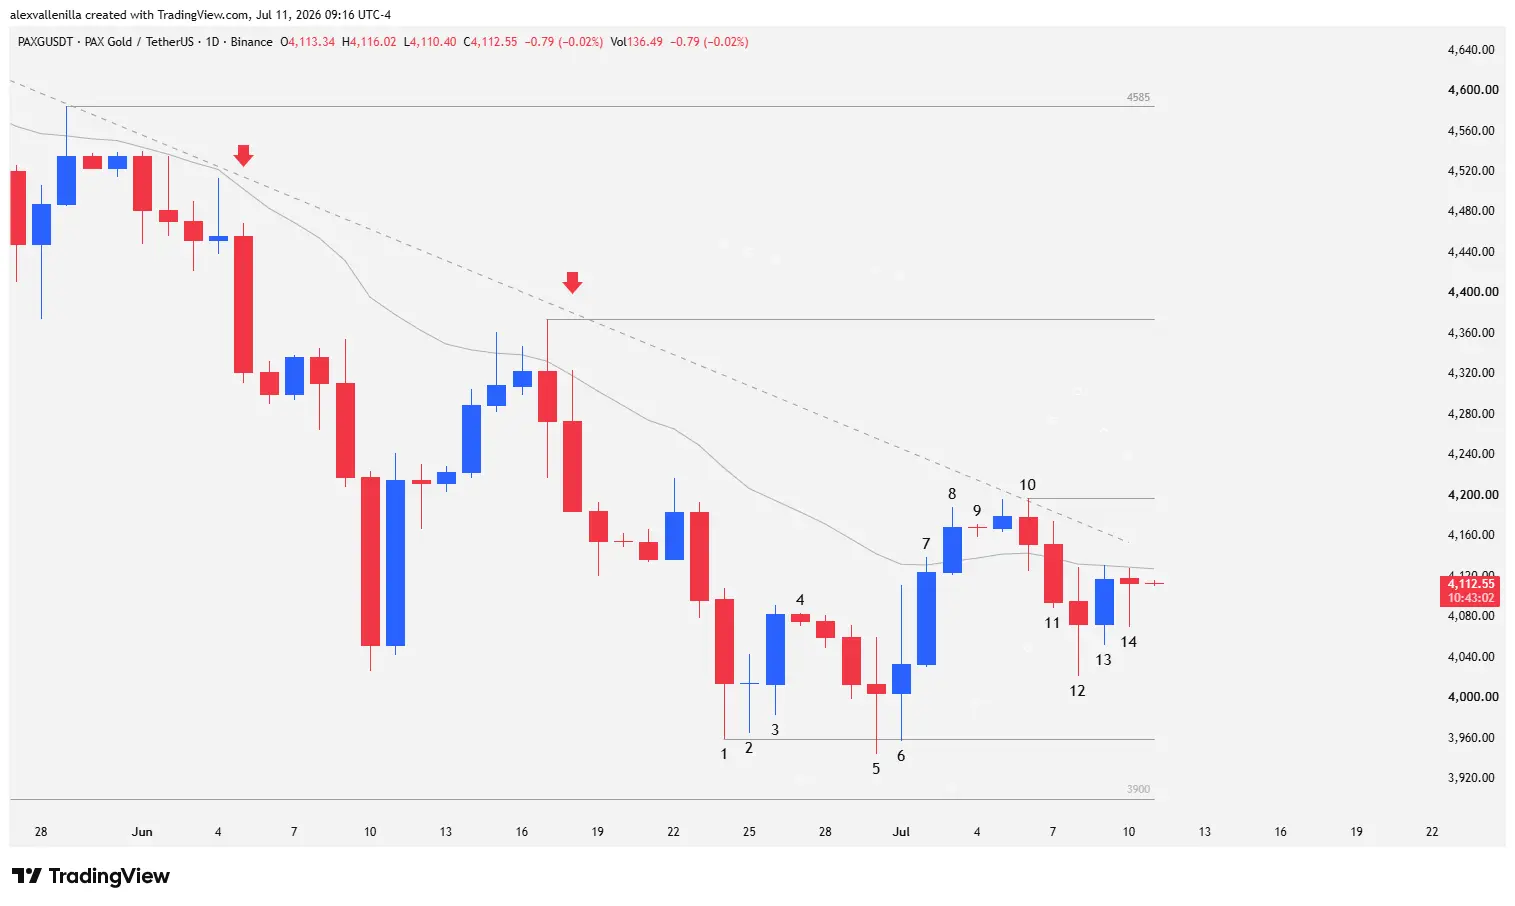
Current price action places the asset at a macroeconomic and technical crossroads. Bears dominate the primary trend, but institutional order flow has detected a key accumulation zone around $3,960, a level where buyers are attempting to structure a reversal against a selling inertia that has already clocked three bearish pushes within the last 59 bars.
Technical Analysis: Breakdown of Order Flow and Price Action
To understand market psychology without lagging indicators, we analyze the interaction between supply and demand through the numerical sequence of Japanese candlesticks on the current chart:
Bar 1: A solid bearish candle opens the sequence. However, the bears fail to test the historical structural support at $3,900 (an illiquid level unvisited in the last 265 bars). Instead, buying flow halts the decline and establishes a new local support at $3,960.
Bar 2: A doji-type bar prints, reflecting indecision. Bears lose traction as the low of this bar fails to test the newly created local support at $3,960 or provide continuity to the previous move.
Bar 3: Bulls take the initiative and execute a technical bounce, clearing the high of Bar 2 and printing both a higher low and a higher high. Reversal intentions become explicit on the chart.
Bar 4: Supply quickly blocks the advance. This appears as an inside bar with a very narrow body. Price enters consolidation and freezes the momentum of Bar 3, turning this move into a technical pullback that traps early buyers and causes the previous reversal to fail.
Bar 5: Bears attack aggressively to resume the decline and test the $3,960 support. The session closes as a high-volatility doji. Following the bearish acceleration, demand firmly defends the zone; the candle fails to close below the low of the previous bar, showing a clear loss of selling momentum.
Bar 6: A fierce battle takes place at the $3,960 support. This bar expands its range and marks a higher high than Bar 5 in a bounce attempt. However, selling flow at the top creates a prominent upper wick (tail) without reaching the 20-period exponential moving average (20 EMA).
Bar 7: Smart money enters the market. Amid an expanding volatility environment, institutional money prints a strong conviction bullish bar that closes above the high of Bar 6. This move validates a technical double bottom (combining the lows of Bar 1 and Bar 6) right on the $3,960 support. The candle triggers a High 2 buy setup (a second attempt at a breakout to the upside), but since it is a counter-trend trade, price gets subtly rejected at the highs and fails to consolidate its close above the 20 EMA.
Bar 8: Initial buying strength triggers stop-market orders upon breaking above the high of Bar 7. The session breaks and closes above the 20 EMA, but its high proves unable to breach the short-term descending trendline projected from the structural high of $4,760. The exhaustion of the three previous bearish pushes attracts retail buyers.
Bar 9: The market dries up. A tiny inside bar interrupts the rally. The subsequent candle attempts to resume the advance but fails, printing a narrow range that fails to clear the high of Bar 8 or the primary descending trendline. Volatility drops abruptly, showing demand exhaustion at resistance areas.
Bar 10: Bears regain control with an outside bar closing lower. The high of this bar acts as the definitive anchor for the upper boundary of a short-term mini descending channel (59 bars). Price establishes a critical local resistance at $4,200 and, while dynamically respecting the 20 EMA, closes below the preceding candle.
Bar 11: Confirmation of the bearish turn. Bears sink the price below the 20 EMA and breach the low of Bar 10. With this action, the market confirms that Bar 9 and its successor operated as EMA gap bars, setting up a classic bull trap. This is the first trap of its kind within the 59 bars analyzed.
Bar 12: Volatility returns via a doji bar with long wicks on both ends. The low pierces the base of Bar 7, invalidating the institutional buy positions structured there. Nonetheless, bears fail to touch $3,960, leaving a higher low relative to Bar 5.
Bar 13: Demand blocks the continuity of the drop and tries to shape a new bounce, but institutional flow lacks volume and the session high surrenders to the dynamic resistance of the 20 EMA.
Bar 14: An inside bar confirms price compression and consolidates the price below the 20 EMA, ceding the strategic initiative to the sellers for the upcoming sessions.
Projective Scenarios: Where Is the Tokenized Metal Heading?
The structural context of PAX Gold reveals an active secondary downtrend within a primary bear market. The fact that the fourth macro breakout attempt failed to beat the low of Bar 1 suggests a clear loss of velocity in the downward move, opening the door for accumulation.
Based on current price action, the technical market splits into two strict scenarios:
Bearish Scenario (Continuation): If supply pierces the local support at $3,959 with body and volume, price will immediately seek the structural level of $3,900. A capitulation below this zone will confirm the extension of the bear market, projecting a free fall toward the next long-term technical target located at $3,270.
Bullish Scenario (Reversal): To validate the structural shift, demand must drive the price above the local resistance at $4,200 (high of Bar 10), breaking the mini descending channel. Subsequently, confirmation of the uptrend will require a clean breakout of the key resistance at $4,370.
In conclusion, PAX Gold trades in a high order-density area where the resolution of the current range will dictate the macro trend for the end of the quarter.
Disclaimer: This article is strictly for informational and educational purposes based on technical analysis of price action. It does not constitute, nor should it be considered under any circumstances as financial advice, investment recommendations, or an invitation to trade digital assets. Every trader is responsible for their own risk management.

Communications Professional. Crypto Enthusiast. Economic Journalist. Bitcoiner & Altcoiner.


