

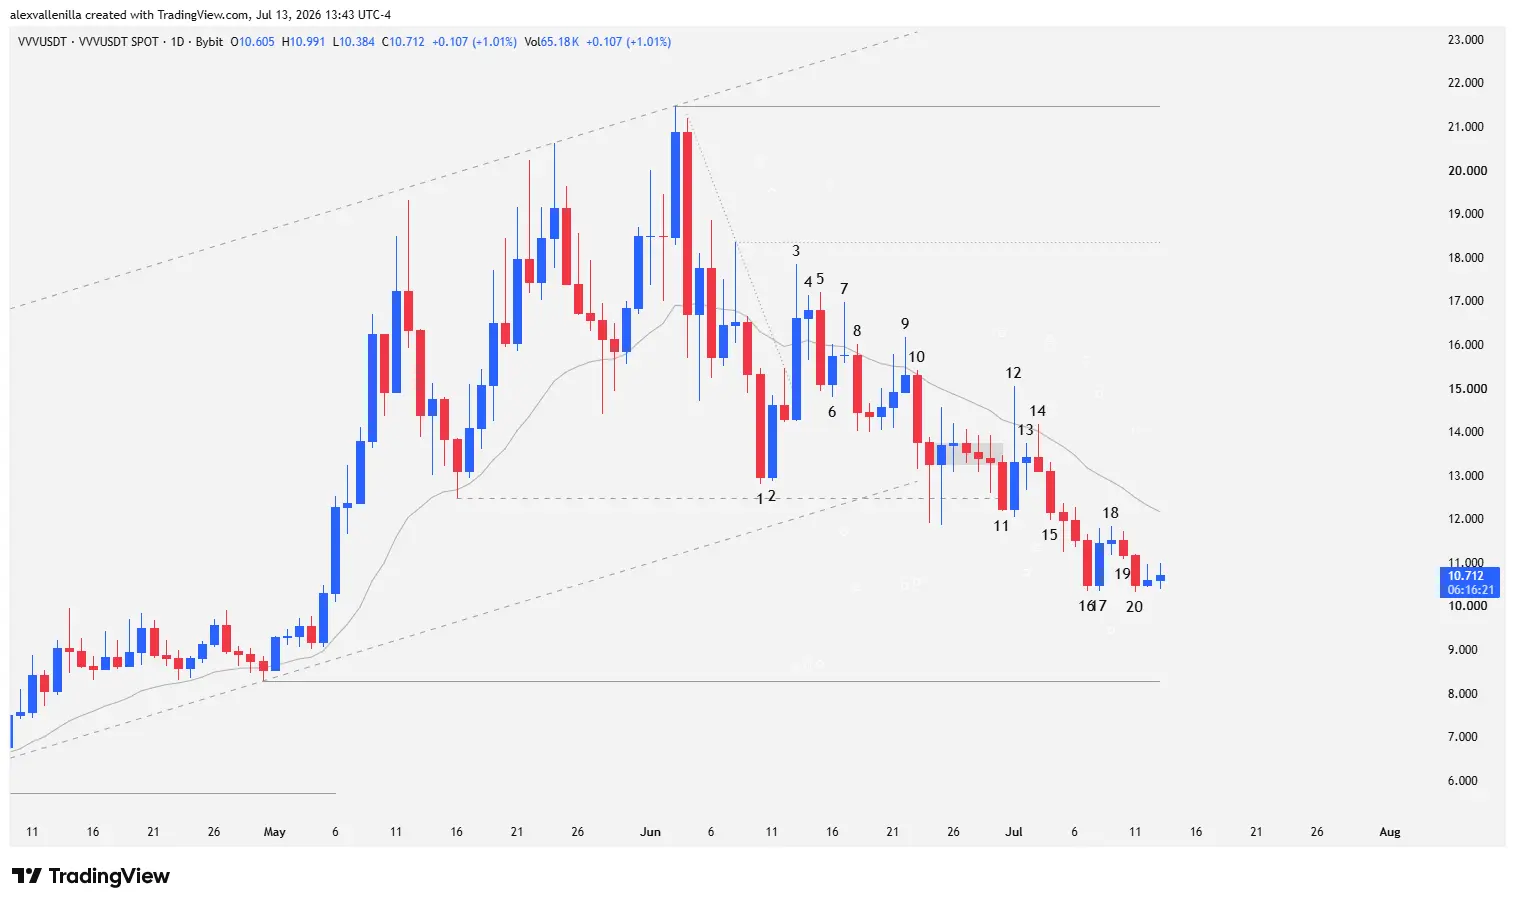
During recent sessions, the crypto asset market has witnessed one of the deepest corrections for Venice Token (VVV). After hitting a local high of $21.46 driven by a bullish acceleration micro-channel, selling pressure took control of the order flow. Bears forced a breakout below local support at $12.48 and the lower boundary of a 131-bar medium-term ascending channel. Despite this pullback, which reduces quarterly performance to 18.62%, VVV maintains a robust year-to-date gain of 552.22% in 2026. The current price battles at a critical area: the vicinity of structural support at $8.27, a zone where institutional order flow could be setting up a bear trap.
Anatomy of a Deep Correction
The DeFi ecosystem and Venice Token investors are experiencing a notable transition in market sentiment. The buyers’ inability to sustain the secondary acceleration structure triggered a cascading sell-off that pierced the 20-period exponential moving average (20 EMA), currently acting as dynamic resistance at $12.15.
This move does not represent a complete failure of the crypto asset, but rather a transfer of weak hands toward macro liquidity zones. The token’s resilience shines through its annual metrics, retaining a 272.73% advance over the last 12 months. However, the short-term loss of momentum keeps traders highly cautious.
Technical Analysis: Price Action Reading and Candlestick Psychology
A detailed analysis of the candlestick sequence reveals the battle for control over order flow:
Bar 1: A climax bar that caps off a two-legged correction. It closes below the 20 EMA, proving supply dominance, though its low fails to test the floor of the 131-bar channel or local support at $12.48.
Bar 2: A buyer reaction that temporarily traps the sellers from the previous bar. Despite the conviction, the high does not exceed the extreme of Bar 1, making way for an immediate pullback.
Bar 3: A bullish breakout attempt that breaches the 20 EMA and the 9-bar bearish micro-channel. It leaves a prominent upper tail, confirming that supply remains active at the top. Crucially, price fails to test local resistance at $18.35, exposing a lack of buying power.
Bar 4 and Bar 5: Bar 4 consolidates as an inside bar. On Bar 5, bears trap late buyers, piercing the previous low and validating the high of Bar 3 as a lower high.
Bars 6 to 10 (Downward Chain): Failed reversal attempts on Bars 6 and 7 (the latter a Doji with a long upper wick). Bar 8 invalidates the move by closing below previous lows. Bar 9 (Pinbar) threatens to cross the 20 EMA but closes below it. Finally, Bar 10 breaks the low of Bar 8, locking price into a downward-biased congestion pattern.
Bar 11: Bears execute an imbalance out of the congestion range. This bar decisively breaks the main ascending channel and destroys the key support of $12.48, invalidating the prior acceleration trend.
Bars 12 to 15 (Lack of Follow-through): Bar 12 trades as an outside bar that pierces the 20 EMA, but closes lower with a notable upper tail. After pauses on Bars 13 (Doji) and 14, Bar 15 reconfirms the loss of the $12.48 level. Two subsequent bars print small bodies, signaling a clear deceleration of bearish momentum.
Bars 16 to 20 (Bear Trap Setup?): Bar 16 acts as a selling climax. Bar 17 halts the plunge as an outside bar, followed by Doji consolidation on Bar 18 and a minor pullback on Bar 19. Bar 20 confirms the pause. The key takeaway: none of the lows of Bars 16, 17, or 20 manage to approach critical structural support at $8.27. This order absorption suggests that the current drop could constitute a bear trap before a structural bounce.
Market Outlook and Closing
Venice Token (VVV) faces an algorithmic and technical crossroads. The loss of the $12.48 level and the exit from the medium-term channel forced retail capitulation. However, the bears’ inability to sink the price to macro support at $8.27 reveals that institutional demand keeps passive buy orders active in that zone. The recovery scenario requires bulls to reclaim the 20 EMA at $12.15 with volume; otherwise, a breach of $8.27 would invalidate the macro structure, extending the correction toward the origin points of the 2026 rally.
Disclaimer: The information presented in this analysis is strictly for educational and informational purposes and does not constitute financial advice or an investment recommendation. Crypto assets exhibit high volatility; invest at your own risk and discretion.

Communications Professional. Crypto Enthusiast. Economic Journalist. Bitcoiner & Altcoiner.


