

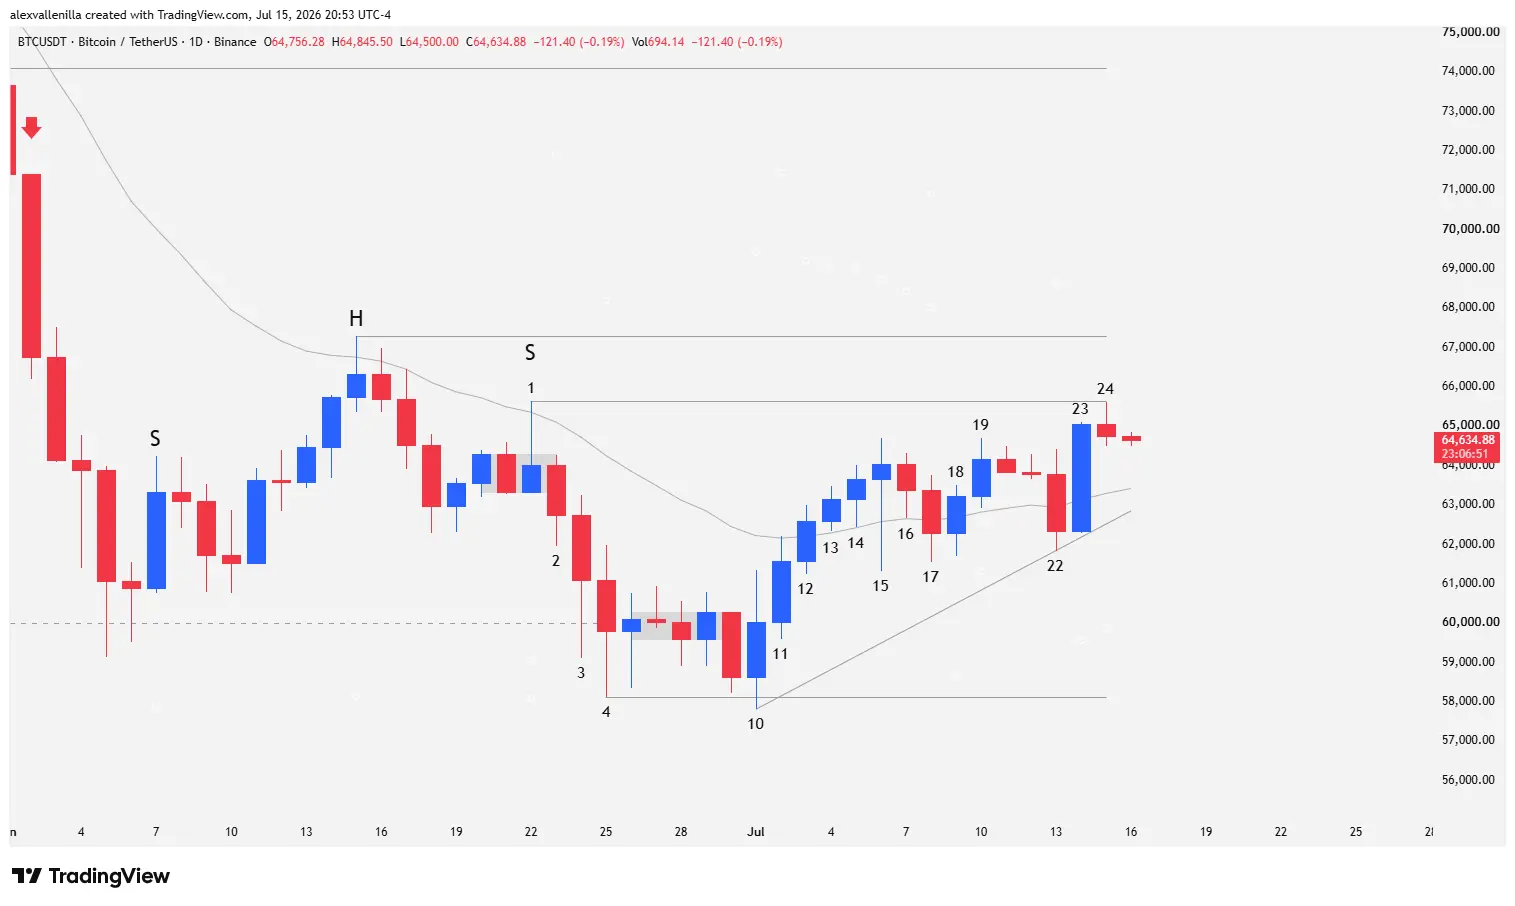
Bitcoin buyers are aggressively defending a new ascending trendline on the daily (1D) chart. After successfully bouncing off critical support at $58,115, the market is now debating the future of the trend. Price is currently compressing just below key resistance at $65,622. A breakout above this level would not only invalidate a dangerous Head and Shoulders (H&S) pattern, but it could also trigger a violent measured move that catapults the king of crypto past $72,000.
The Battle for $65,622: Psychology and Order Flow
The bitcoin market is going through a crucial accumulation phase following a prolonged, long-term downtrend that spanned the last 284 sessions. Price halted its decline in its tracks by validating support at $58,115, refusing to confirm the dreaded bearish breakdown of the Head and Shoulders pattern.
The resistance zone at $65,622 (which coincides with the Bar 1 high and the right shoulder of the structure) is the last line of defense for sellers. If price manages to trade above this barrier and subsequently breaks above the head of the pattern at $66,292, we will witness a classic chart pattern invalidation.
In modern technical analysis, the invalidation of such an obvious bearish structure typically acts as a powerful buying catalyst, trapping short sellers and forcing them to cover their positions (short squeeze), rapidly driving the price toward measured move targets.
Detailed Technical Analysis: Candlestick-by-Candlestick Price Action
To understand the behavior of institutional traders and recent order flow, we must break down the price action from Bar 12 to Bar 24 on the daily (1D) chart.
Bars 12 and 13: Triggering the Bullish Counterattack: Buy Order Activation.
Bar 12 is a high-probability High 2 bullish candle. It manages to break and close above the 20-period exponential moving average (20 EMA), confirming a solid double bottom structured by the lows of Bar 4 and Bar 10.
Immediately after, Bar 13 takes out the high of the previous bar, triggering buy orders from counter-trend traders. This move breaks a short-term descending trendline that had been capping price action since the Bar 1 high.
Bars 14 and 15: Volatility and Supply Absorption: Outer Pinbar Appears.
Bar 14 continues the buying pressure from the previous session, consolidating the price above the 20 EMA. However, volatility explodes in Bar 15: an outside pinbar candle won by the bulls after printing a long lower wick (tail). This rejection shows that bears tried to push the market down but got trapped as strong hands absorbed the supply.
Despite the rejection, this bar completes a bullish deceleration; candle bodies from Bar 10 to Bar 15 narrow progressively, revealing a loss of momentum. The high of Bar 15 fails to test the key resistance at $65,622.
Bars 16, 17, and 18: Pullback Lacking Bearish Conviction: Dynamic Support Tests.
Bar 16 develops as an inside bar, temporarily freezing the bullish momentum and suggesting a pullback. Although the bears win this session, the candle’s low tests the 20 EMA but fails to close below it.
In Bar 17, supply manages to trade momentarily below the 20 EMA, closing below the previous session’s low. However, it is a very narrow-range candle with tails on both ends, showing a complete lack of bearish conviction. Furthermore, its low remains notably higher than the lows of Bars 15, 11, and 10.
Detecting this weakness, bulls take control in Bar 18 (a consolidation and reversal candle), closing the price back above the 20 EMA.
Bars 19 and 22: Defending Resistance and a New Compression Trendline: Higher Low Structure.
Bar 19 extends the recovery by closing above the Bar 18 high. However, bears actively defend the $65,622 zone, leaving a small upper tail and marking a high slightly lower than that of Bar 15.
After a two-session pause, sellers attack in Bar 22 with a Low 2 sell setup, briefly breaking below the 20 EMA. Despite this, the low of Bar 22 acts as a fundamental anchor point: it defines a new 15-bar ascending trendline starting from the Bar 10 low. This trendline compresses the price upward against the horizontal resistance of Bar 1.
Bars 23 and 24: Institutional Block and Warning Wick: Strong Hands Presence.
In Bar 23, institutional buy orders step in. The chart prints a wide-range candle with excellent body and virtually no tails (a high-conviction marubozu). This move completely negates the bearish signal of Bar 22 and traps sellers who were looking for a pullback. The high exceeds the peaks of Bars 15 and 19, although it once again falls just short of touching $65,622.
Finally, Bar 24 fails to find immediate follow-through after the previous breakout. Bears manage to form a small, very narrow-range pinbar candle. Despite this minor pullback, this session’s low does not even threaten 50% of the body of the massive bullish Bar 23, indicating that demand remains firmly in control.
Projections: Bullish and Bearish Scenarios for BTC
The current structure presents us with a high-tension technical scenario:
Bullish Scenario (Squeeze Validation): If buyers manage to breach resistance at $65,622 and invalidate the H&S head at $66,292, short sellers’ stop losses will trigger en masse. This will fuel a measured move equivalent to the distance between Bar 10 and Bar 15, projecting bitcoin’s price in a two-legged cycle toward a technical target above $72,000.
Bearish Scenario (Structure Failure): If supply successfully defends the area and demand fails to break resistance, the 20 EMA (sitting at $63,407) will act as the most critical immediate support. Below that, the ascending dynamic trendline converges at $62,842. If both levels fail and the low of Bar 17 is lost, price could slide back down to seek liquidity at the critical $58,115 support.
Bitcoin is in a technical accumulation phase where operational patience is key. The bears’ failure to find follow-through on the Head and Shoulders pattern has left the market vulnerable to a violent upward move driven by a short squeeze. Detailed price action analysis shows that strong hands are accumulating and defending the new ascending trendline. Overcoming $65,622 once and for all will be the trigger that determines if we are on the verge of a new bullish rally.
Disclaimer: This analysis is strictly for educational and informational purposes and does not constitute financial advice or investment recommendations. Cryptocurrencies are highly volatile assets; only risk capital you are willing to lose.

Communications Professional. Crypto Enthusiast. Economic Journalist. Bitcoiner & Altcoiner.


