

The meme coin market shows no mercy, and SPX6900 (SPX) has become the epicenter of a high-intensity liquidity war. Following a violent breakout attempt that collapsed at historical resistance, the price suffered a cascading sell-off that trapped late buyers. However, a solid buy order block emerged at lower levels to reshape the technical outlook, turning the chart into a range-bound battlefield. Traders are now closely watching a higher-lows pattern that suggests accumulation, while sellers aggressively defend upper supply levels to maintain the long-term bearish bias.
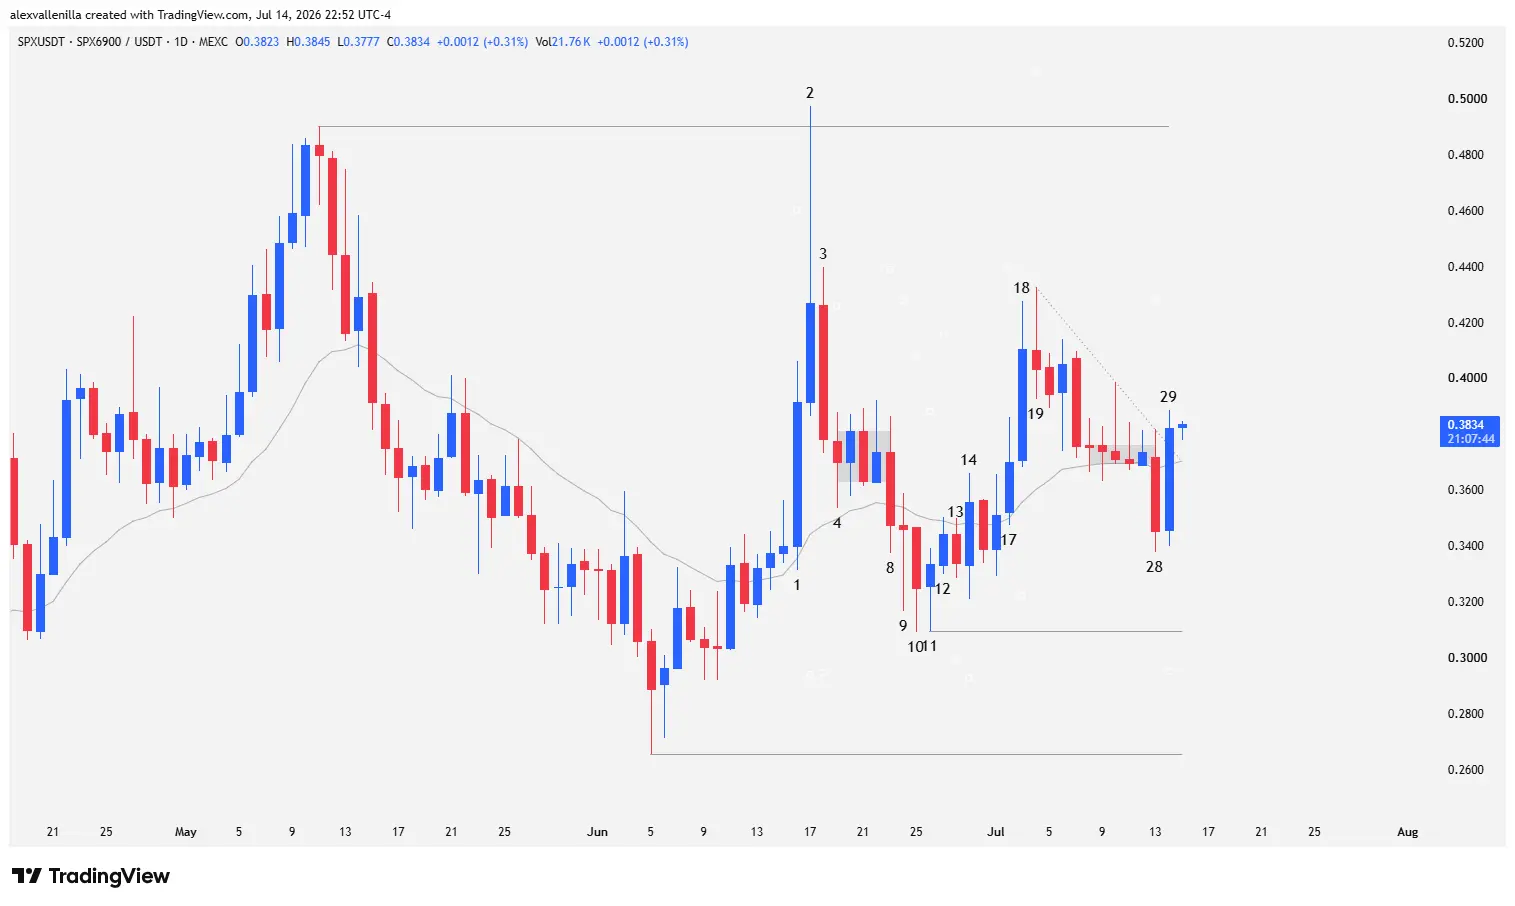
Chart Anatomy: A Candlestick-by-Candlestick Reading of SPX Order Flow
SPX6900’s recent price action offers a masterclass in market psychology, where every candle on the chart reveals the transfer of power between institutional strong hands and retail capital.
The FOMO Bait and the Bearish Response (Bars 1 to 4)
The action begins with Bar 1, a high-conviction bullish candle showing a massive influx of institutional capital. Strong hands temporarily take control, driving the price up aggressively and piercing above the 20-period exponential moving average (20 EMA), triggering bullish continuation alarms.
However, optimism immediately fades in Bar 2. Although buyers try to follow through on the move, they collide directly with macro resistance at $0.4903—a critical technical level representing the last key swing high of a prolonged, 300+ bar bearish structure. The resulting candle is a massive-range pinbar with a giant upper wick. Bears aggressively defend the zone; the price momentarily pierces the upper level only to suffer a violent rejection. This move constitutes a classic failed breakout (bull trap), sweeping all the liquidity of buyers trapped by greed or FOMO (Fear of Missing Out).
The trapped buy orders trigger immediate capitulation. Bar 3 prints as a high-conviction bearish pullback candle, reflecting a massive sell-off as the stops of trapped traders get hit. Bar 4 continues the decline and manages to close below Bar 3’s low, showing persistent supply. However, this bar closes as a doji, injecting indecision into the market as the price stalls just before testing the 20 EMA. From this point, the price enters a compression or micro-range phase, marked by a lack of clear direction.
Capitulation and the Market Turnaround (Bars 8 to 14)
The micro-range paralysis ends abruptly with Bar 8, a candle that breaks below the consolidation base and secures a solid close below the 20 EMA, handing control back to the sellers. Pressure extends into Bar 9, a doji with a wide lower wick. This chart signature reveals that despite the bearish momentum, latent buy orders are starting to absorb available supply. By failing to close below Bar 8’s low, Bar 9 provides the first sign of slowing selling pressure.
Bears make one final push in Bar 10, trying to extend the decline. However, they fail to close below Bar 9’s low, leaving another lower wick that betrays the presence of institutional buyers. From a structural perspective, Bar 10 completes a symmetrical, two-legged bearish move from Bar 2’s high—a mature pattern that technically points to an impending reversal.
Confirmation of the turnaround arrives with Bar 11, a textbook bullish pinbar. This candle develops a prominent lower wick that, combined with the rejections of Bars 9 and 10, solidifies a pattern of massive sell order absorption. Bulls capitalize on this support, establishing a firm floor at $0.3095. By halting the downward momentum, Bar 11 formally kicks off the price reversal. Bar 12 validates this move by providing the necessary bullish follow-through and breaking the micro-bearish channel that had dragged the price down since Bar 2, although it closes slightly below the 20 EMA.
Bar 13 acts as a pause or minor pullback candle. Even though it temporarily stalls the advance, bears fail to drag the price below Bar 12’s low, highlighting significant supply exhaustion. The response is definitive: Bar 14 emerges as a powerful bullish outside candle. This bar completely engulfs Bar 13’s structure, breaks its high, and forcefully reclaims the 20 EMA, marking a definitive failure of the bearish pullback.
Volatility and Trapped Order Blocks (Bars 17 to 29)
The rally continues with some turbulence. Bar 17 confirms the strength of the institutional breakout above the 20 EMA (after a failed pullback between Bars 15 and 16) but displays a considerable upper wick, signaling high volatility and the early return of selling pressure. Bar 18 maintains the momentum and breaks the previous high with high conviction, but repeats the pattern of leaving a noticeable upper tail.
The trap springs on Bar 19. Bears retaliate with a bearish-closing pinbar and a prominent upper wick. This candle completely halts the development of a second bullish leg that was targeting yearly highs, trapping buyers who rushed in on Bar 18. By putting its high significantly below the key $0.4903 zone, Bar 19 establishes a lower high in the macro structure. The rejection gets immediate validation on Bar 20, kicking off a new decline.
After Bar 22, the price stalls again in a short-term consolidation pattern, showing a moderate bearish bias. On Bar 28, sellers manage to pierce the base of this micro-range and close below the 20 EMA, attempting to trigger a broader sell-off. However, the market has a surprise in store: Bar 29 explodes as a massive, high-conviction bullish candle. This move catches short sellers from Bar 28 off guard, trapping them in losses and invalidating the bearish breakdown. Bar 29 reclaims the 20 EMA in a single move, destroys the bearish trendline of the last 11 sessions, and cleanly breaks above the high of the preceding candle.
Market Structure and Key Scenarios for SPX
The technical picture shows SPX6900 trading within a range bound by resistance at $0.4903 and critical support at $0.3095. Crucially for the bullish thesis, this floor represents a higher low compared to the previous support at $0.2655 (the origin of the impulse that collapsed on Bar 2). In turn, the latter remains above the main downtrend support located at $0.2224—a deep structural level that bears have failed to test over the last 159 bars.
To validate a medium-term bullish structural transition, buyers must break the lower high established by Bar 19. Success here would clear the path for another test of $0.4903. If volume supports the move and a clean breakout of this ceiling occurs, SPX will invalidate the macro bearish structure, opening up technical targets toward historical resistance at $0.6777.
In the opposite scenario, if supply takes over again and the price resumes its decline, the first defensive line bulls must protect is at $0.3095 (the low of Bar 11). A breakdown below this level would invalidate the higher-lows sequence, forcing an extended correction toward the secondary demand zone at $0.2655.
Technical Wrap-Up: The Importance of Current Order Flow
The relentless absorption of supply at lower levels and the consecutive higher lows show that despite heavy rejections at the top, strong hands continue to accumulate SPX6900 on pullbacks. The failed bearish breakout on Bar 29 confirms the resilience of demand. The upcoming daily closes above the 20 EMA will dictate whether the market has the fuel to challenge macro resistance or if it will remain range-bound.
Disclaimer: The technical analysis presented in this article is for educational and informational purposes only and does not constitute financial, investment, or trading advice. Cryptocurrencies and, in particular, meme coins exhibit extremely high volatility. Never invest money you cannot afford to lose.

Communications Professional. Crypto Enthusiast. Economic Journalist. Bitcoiner & Altcoiner.


