

HYPE is experiencing notable price compression on its daily chart after posting stellar gains of 164.0% Year-to-Date (YTD), 42.92% over the past year, and 13.41% over the last month. Currently, the asset is locked in a crucial technical battle between key resistance at $75.75 and a dynamic ascending trendline. Traders and institutional investors are rigorously analyzing order flow and bar-by-bar price action to decipher whether this is an accumulation pattern prior to an explosive rally toward triple digits, or a sophisticated distribution zone.
Technical Price Action Analysis
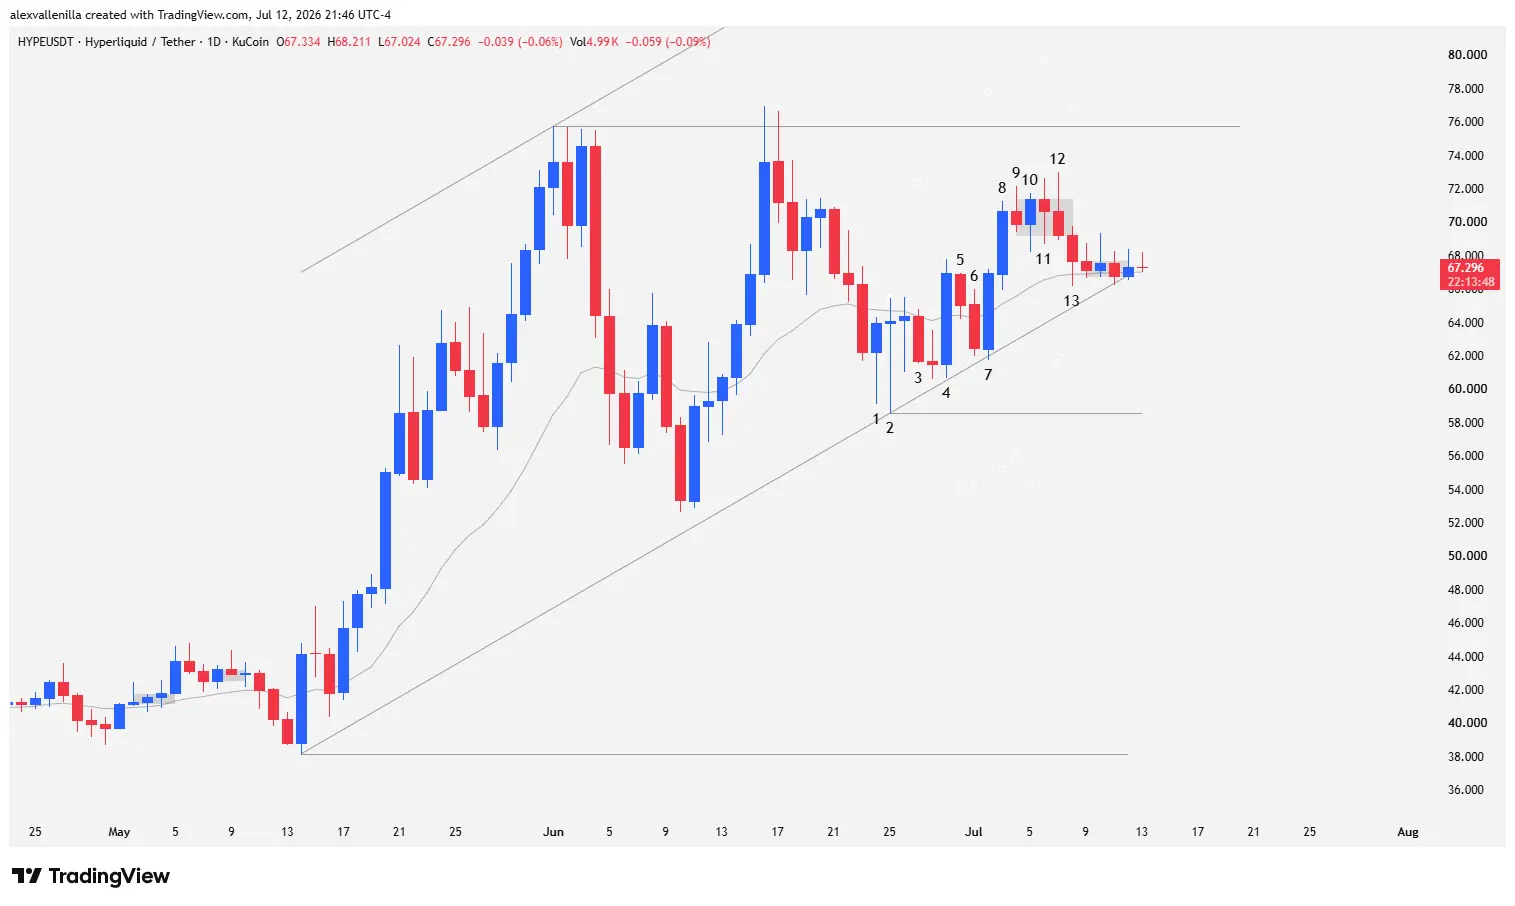
Recent price behavior reveals an exact roadmap of market psychology through a detailed study of the last thirteen candles on the daily timeframe:
Bar 1: A pinbar halts a two-legged downward impulse. This corrective move represents the first explicit rejection at macro resistance of $75.75. It materializes as a counter-trend move within a recent 59-bar bullish impulse and, simultaneously, forms part of a secondary uptrend within a larger 459-bar cycle.
Bar 2: An outside bar confirms exhaustion of the decline. This extreme pinbar features a very narrow body and a prominent lower shadow or tail that completely engulfs the range of Bar 1. The temporary piercing of the 20-period exponential moving average (20 EMA) and subsequent absorption signal high institutional volatility: buyers defend the new support established at $58.55, a level that also acts as the lower anchor of the short-term ascending channel.
Bar 3: Functions as an inside bar that locks in a minor pullback. Bears prevent price from consolidating above the 20 EMA, triggering a reversal failure in the microcycle. The subsequent candle extends the bearish tone without testing the base of the dynamic channel.
Bar 4: Buyers regain control with a high-quality, wide-range candle. It breaks above the 20 EMA, closing more than 50% of its real body above that average and leaving minimal shadows on both ends—an unequivocal sign of sustained buying pressure.
Bar 5: A bearish inside bar interrupts momentum. Sellers attempt to neutralize the strength of Bar 4, but the pullback shows weakness as it fails to penetrate even 50% of the prior body, keeping price above the 20 EMA.
Bar 6: Consolidates the previous pullback, exerting selling pressure; however, the session low respects and validates the lower side of the ascending channel.
Bar 7: A bullish outside bar executes a short squeeze or bear trap, trapping sellers from Bars 5 and 6 by taking out their correlative highs and placing price action firmly back above the 20 EMA after the dynamic retest.
Bar 8: Follows through on the prior move but faces a severe block, closing below local resistance at $70.93. This level corresponds to the control point of the previous 12-bar micro-descending channel stemming from the original rejection at the highs.
Bar 9: Failed attempt to break the highs of Bar 8. Bears force a daily pullback, keeping price contained below resistance at $70.93.
Bar 10: Negates the previous bearish bias by forming a pullback failure and managing a precise close just above the $70.93 zone.
Bar 11: A doji candle with a bearish close immediately invalidates the previous session’s breakout. This “failure of a failure” pattern indicates volatility contraction at the upper end of the range, pointing toward a distribution process.
Bar 12: Buyers attempt to push the upper zone but institutional sell order flow strongly repels them, creating a very long upper shadow relative to its body. While it does not break the previous low, it consolidates a micro-congestion range. The lower high relative to the previous peak reveals a substantial loss of momentum and demonstrates an inability to test $75.75. Nonetheless, it completes a latent third push in a higher-low structure that compresses price against the technical ceiling.
Bar 13: Bears trigger a downside breakout of the micro-congestion range. The candle slightly pierces the 20 EMA without confirming a close below it, and as the session ends, price begins a congestion pattern just above the channel’s dynamic support.
General Structure and Market Outlook
The technical structure of HYPE reflects a mature uptrend starting to show signs of deceleration and exhaustion at its psychological and mathematical resistance of $75.75, where it has already accumulated two sharp rejections. Classical price action theory warns that when the market fails twice consecutively to reach or break a target objective, the probability of a deep corrective move increases.
However, buyer resilience remains notable: higher lows find support with surgical precision on the dynamic support of the 59-bar channel, currently trading around $66.80. The tension building within this geometric compression formation points to an imminent and volatile resolution.
Bullish Scenario: If buy order flow manages to cleanly break and confirm above resistance at $75.75, it will activate a measured move equal to the first accelerating bullish impulse. This would trigger a rally with technical projections clearing $100.00 per token, exploring new all-time highs.
Bearish Scenario: If dynamic support at $66.80 gives way to selling pressure, price will confirm a breakdown of the short-term ascending channel, opening the door to a larger correction. The primary technical target and first relevant structural support sits at $58.55, a level established by the absolute low of Bar 2 and the trend’s base anchor.
Current HYPE behavior represents a textbook case study for price action analysts. Backed by highly robust yearly metrics (164% YTD), bitcoin’s peer is at a crossroads where patience and daily close confirmations will dictate whether it solidifies the path to $100 or if the market demands a healthy correction to macro support levels.
Disclaimer: This analysis is strictly for informational and educational purposes based on price action methodology. It does not constitute, under any circumstances, investment advice or financial recommendations. Crypto assets exhibit high volatility; only risk capital you are prepared to lose.

Communications Professional. Crypto Enthusiast. Economic Journalist. Bitcoiner & Altcoiner.


