
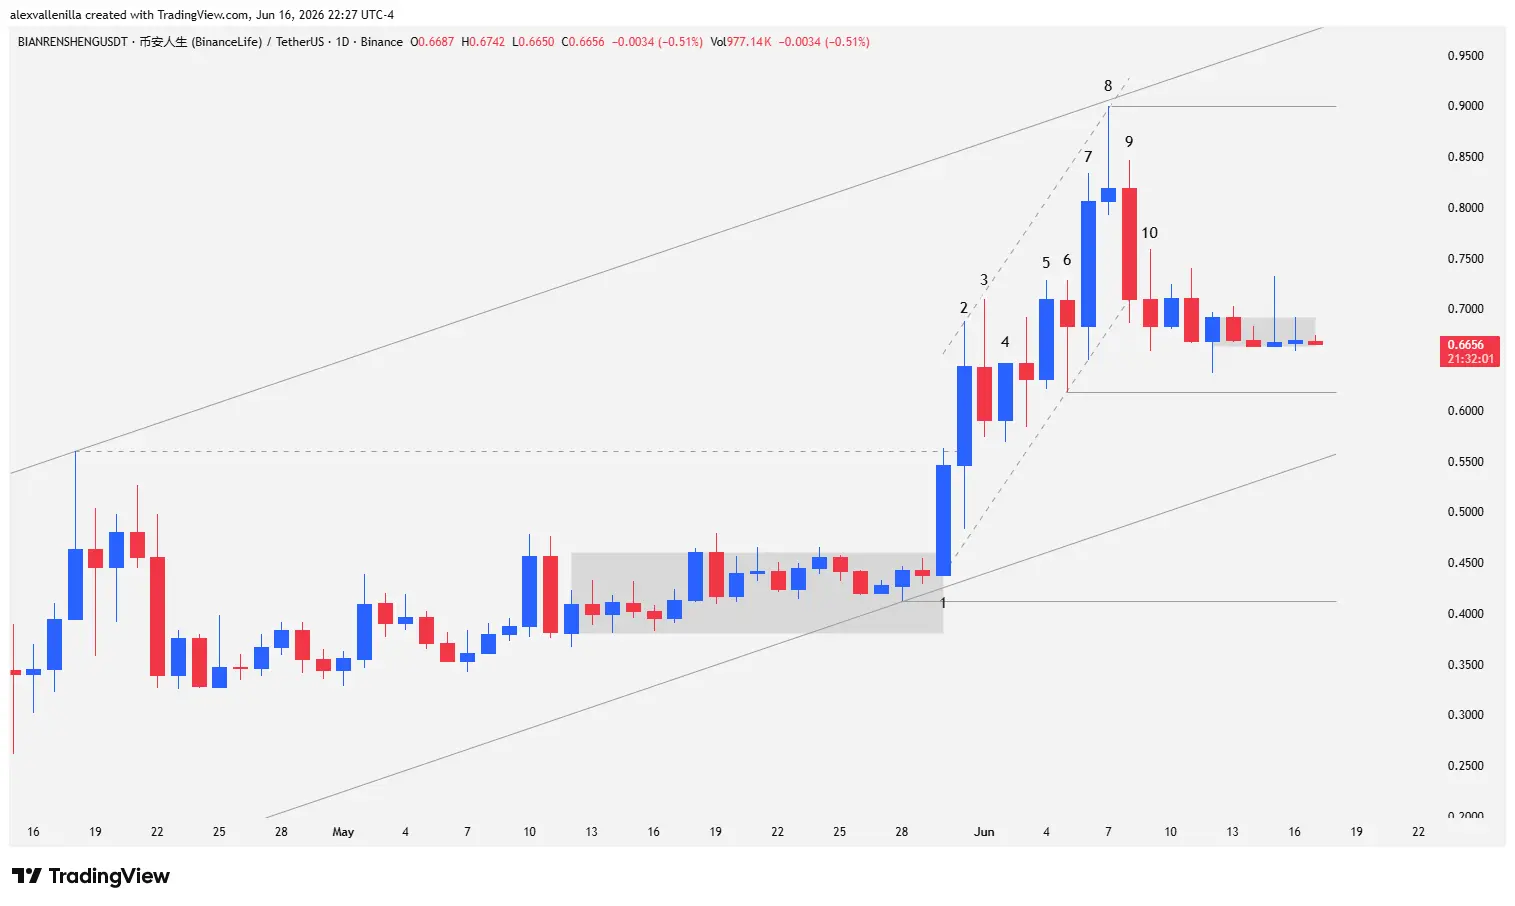
The digital finance market is witnessing a strategic pause in the BIANRENSHENG/USDT (币安人生) daily chart (1D). After unleashing a vertical impulse that shattered previous resistance levels, the asset currently trades in a congestion phase or micro trading range. This deceleration occurs immediately after printing its all-time high (ATH) at $0.8999, an area where institutional players triggered massive distribution orders, forcing a retracement toward the critical local support at $0.6180, where bulls attempt to defend the macro bullish structure.
Price Breaks Consolidation and Triggers Institutional Momentum
The BIANRENSHENG price action initiated a technical metamorphosis by forcefully breaking out of a previous accumulation range. Driven by professional order flow, this bullish breakout expanded volatility and forced short positions (bears) to hastily cover losses, fueling the initial rally.
The injection of institutional liquidity propelled the asset along a 69-bar primary ascending channel, establishing a solid bullish structure. However, the exponential acceleration observed in recent sessions triggered technical exhaustion alarms—a characteristic dynamic in crypto markets when retail FOMO reaches its peak.
Technical Analysis: Bar-by-Bar Price Action Breakdown
Order flow behavior and collective market psychology reveal themselves clearly through a detailed breakdown of the latest Japanese candlestick sequence:
Bar 1 (Breakout Bar – Bull Trend Bar): This wide-range bull trend bar acts as the main catalyst for the move. By decisively breaking above the previous consolidation box and closing near its high, it validates the presence of institutional buying volume and triggers market buy stops. Its low establishes a higher low, providing continuity to the 69-bar macro trend.
Bar 2 (Strong Continuation): A bull trend bar with a dominant real body that confirms momentum. It successfully breaks the resistance at $0.5599 (the previous impulse high), a level that now serves as the anchor for the upper side of the primary ascending channel.
Bar 3 (Pause / Pullback Bar): The first sign of friction. Price experiences intraday profit-taking and closes near its open. However, its low stays above the lows of bars 1 and 2, setting the stage for the next leg up.
Bar 4 (Failed Pullback): Although the session opens with bearish pressure (leaving a lower tail), smart money defends the trend. Buyers push price to secure a bullish close above the open and the close of Bar 3. By invalidating bearish continuation, it traps bears and confirms the failed pullback.
Bar 5 (Momentum Resumption): A bull bar that engulfs the body of Bar 4, printing higher highs and higher lows than Bar 3. It shows that institutions continue to absorb available supply at higher prices.
Bar 6 (Indecision Bar / Doji): It features a small body with tails on both ends, denoting a strategic pause. The low of this session establishes a key anchor point to project a secondary trendline (a 9-bar mini-channel) and defines local support at $0.6180.
Bar 7 (Climatic Acceleration): An expanded-range bull bar denoting extreme volatility. While it reflects strong conviction, its position at the top of the structure classifies it as a climatic bar (Buying Climax), a phenomenon that typically precedes severe corrections due to demand exhaustion.
Bar 8 (Buying Climax and ATH): The pivotal session of the structure. Price prints the crypto’s all-time high at $0.8999 upon touching the mini-channel resistance. However, the inability to test the top of the primary 69-bar channel reveals deep exhaustion. Massive sell orders slam the price, causing a close far below the highs and leaving a massive upper tail.
Bar 9 (Reversal Confirmation – Bear Trend Bar): A wide-range bear trend bar with a solid body that closes near its lows, completely engulfing the body of Bar 7. This massive profit-taking pierces the lower side of the 9-bar ascending mini-channel, confirming that supply has taken control.
Bar 10 (Bearish Continuation): Selling pressure intensifies, breaking below the lows of previous days, driven by panic from late buyers executing their stop-losses.
Subsequent Behavior: Price Seeks Refuge at $0.6180
Following Bar 10, volatility contracts significantly. The chart prints small, overlapping bodies that form a micro trading range to the right of the structure. Despite the lack of clear direction in the short term, current session lows rigorously respect local support at $0.6180.
This technical level holds heavy significance: it coincides with the high of Bar 2 and the anchor of Bar 6, transforming a former resistance into a structural floor ideal for absorbing the excess of the previous climatic move.
Future Price Action Scenarios
The macro and structural bias of BIANRENSHENG preserves its bullish nature due to the magnitude of the prior impulse, defining two breakout scenarios for the coming days:
Bullish Scenario: If buyers manage to break above the top of the current micro range with rising volume, price will initially target the psychological $0.8000 zone, aiming for an ATH retest at $0.8999.
Bearish Scenario: If supply pressure pierces local support at $0.6180, it will invalidate the consolidation structure. This will force a deeper correction in search of institutional liquidity, projecting technical targets toward the base of the macro channel or the initial breakout zone near $0.4100.
Disclaimer: This analysis is strictly for informational and educational purposes based on price action. It does not constitute, nor should it be interpreted as, investment advice, financial recommendation, or a solicitation to trade digital assets. Cryptocurrency markets exhibit high volatility; only risk capital you are willing to lose.
Communications Professional. Crypto Enthusiast. Economic Journalist. Bitcoiner & Altcoiner.