

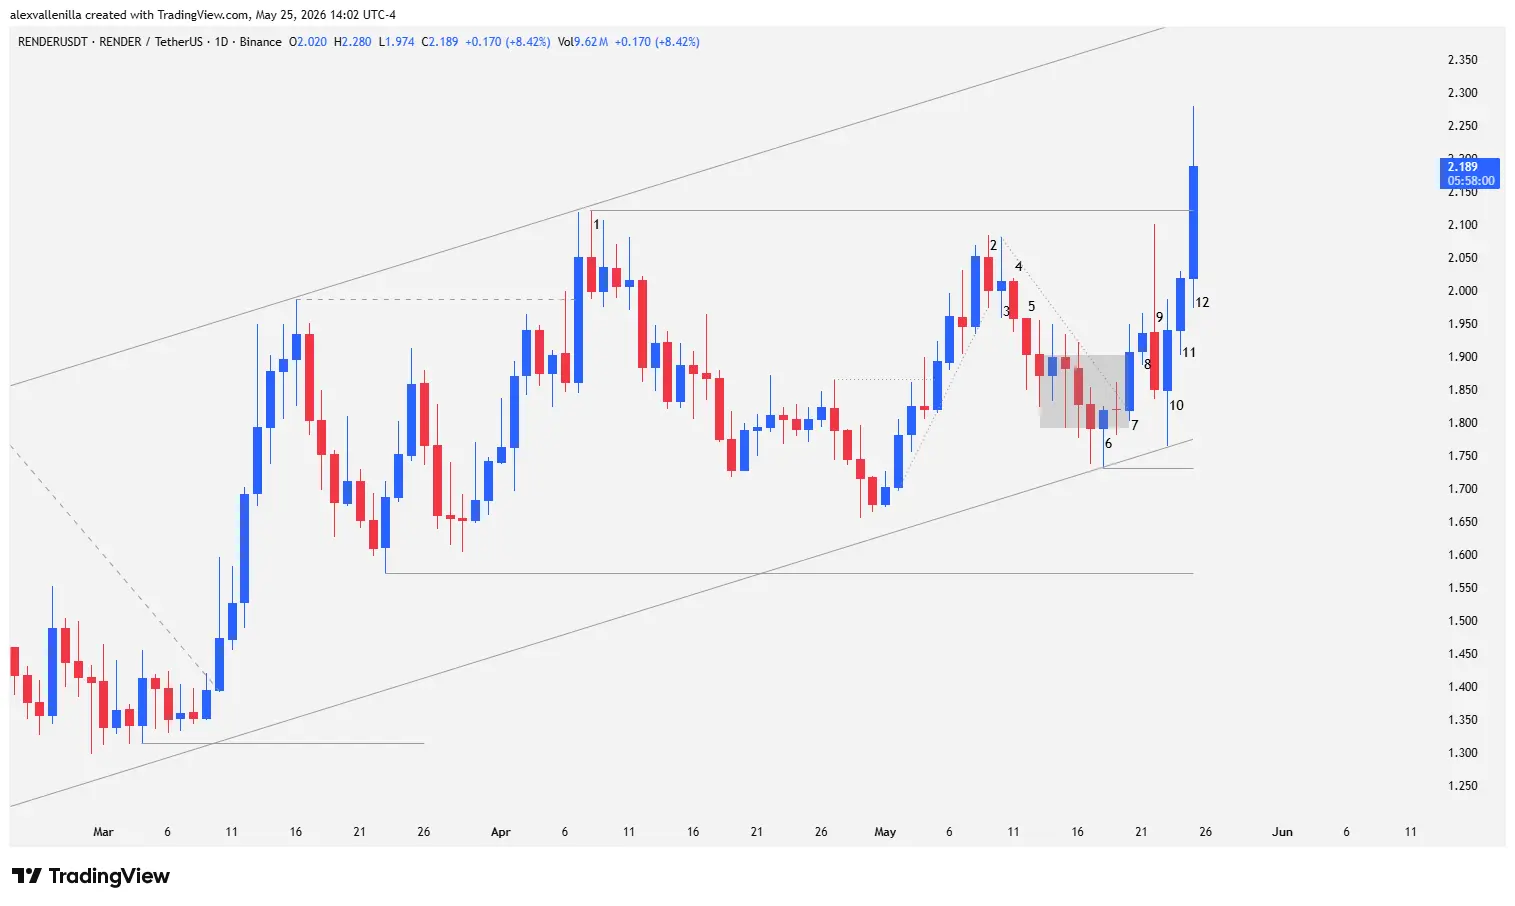
The artificial intelligence and decentralized rendering cryptocurrency market is once again capturing the attention of the crypto community. At the time of writing, the RNDR token trades at $2.189, printing a partial gain of 8.42% in the daily session. Following a prolonged period of consolidation and price compression under the $2.122 resistance, buyers have managed to pierce the previous 460-bar bearish structure. This move invalidates seller pressure and opens the door for a bullish acceleration that aims to solidify macro control for the bulls.
Compression, Volatility, and Breakout: The Battle on the RNDR Daily Chart
Render’s recent technical development exposes a classic market transition from a micro-congestion phase to a volatility expansion, perfectly mapped by pure price action without lagging indicators.
Retracement and Congestion Phase (“Barbed Wire”)
The main uptrend, which already extends for 108 bars, experienced a temporary pause starting at Bar 2. This narrow-range bearish bar signaled the retracement of a previous micro-channel, demonstrating exhaustion by failing to test the high of Bar 1 at the $2.122 resistance.
Although Bar 3 set up as a bullish-closing Doji attempting a retracement failure, it lacked follow-through. By breaking the short-term bullish micro-channel, it attracted institutional sellers who forced Bar 4. This session resumed the decline with greater decision and consistency, operating as a “failure of a failure” due to the bulls’ inability to sustain the previous structure.
The decline found friction at Bar 5. Despite closing below the previous low, a bottom tail identical in size to its body evidenced that limit buy orders were actively absorbing the massive supply. This led to a severe, choppy congestion pattern in the form of “barbed wire” between bars 5 and 6. The constant overlapping of small bodies and long two-way tails confirmed a total loss of bearish momentum right above the macro trendline.
The Structural Shift and the Ascending Triangle
The bear capitulation solidified at Bar 6, a textbook Pinbar with a bullish close and a bottom wick that doubled its body size. Its low established critical structural support at $1.732, holding well above the previous support at $1.572 and acting as the definitive anchor for the trendline of the 108-bar bullish channel.
The buyers’ response was immediate:
Bar 7: Bulls attacked with a +4.84% impulse. Despite the volatility reflected in its tails, the bar broke out of the congestion by closing above the range of Bar 6 and invalidated the bearish micro-channel born at Bar 3.
Bar 8: A small bullish candle extended the move. It showed some loss of momentum but posted a higher high.
Bar 9 (Outside Bar): Volatility exploded drastically. This session became a massive-range outside bar that swept the market in both directions. Bulls catapulted the price near the $2.122 resistance, but limit sell orders and profit-taking at the upper end pushed the price back down, triggering a bearish close below the low of Bar 8.
Bar 10: Bears tried to capitalize on the rejection from Bar 9 by pressing toward the macro trendline. However, a prominent bottom tail demonstrated renewed limit order absorption. Closing completely engulfed within the body of the outside bar, it confirmed demand resilience.
This behavior outlined an Ascending Triangle: a fixed horizontal resistance zone at $2.122 (Bars 1, 2, and 9) against consecutively higher lows at the channel floor, tightly compressing price for an imminent move.
Current Status and Macro Projections
The resolution of the compression structure played out over the last two sessions of the chart:
Bar 11 saw a drop in volatility and returned absolute control to the buyers, printing a 4.02% advance with an almost non-existent top wick, closing above the high of Bar 10.
Finally, Bar 12 (in development at the time of this report) locks in the formal breakout of the $2.122 resistance, reaching a price of $2.189. While the session exhibits an increase in volatility with tails on both ends, the strong vertical displacement confirms market continuation following the accumulation and rest phase.
Bullish Scenario
Solidifying a daily candle close above $2.122 validates the ascending triangle breakout. Technically, this allows price to target the dynamic resistance at the upper band of the bullish channel. A definitive breakout there will clear the path to test the key macro level at $2.712, the last major high within the previous 460-bar downtrend.
Bearish Scenario
Any fakeout or late rejection that pulls price back inside the structure will trigger an orderly retracement. In this case, the lower side of the bullish channel offers solid dynamic support at $1.775, a zone protected by institutional buy order flow. However, the dominance of wide-range candles and solid bodies on the buying side reduces the probability of success for the bears in the short term.
Render’s price action demonstrates the power of structural compression. The transition from a congestion pattern trapped in “barbed wire” to an ascending triangle breakout confirms that buyers control the order flow. By convincingly invalidating the resistance at Bar 1, RNDR not only resumes its 108-bar uptrend but positions itself for a definitive technical regime shift on a macro scale.
Disclaimer: The information presented in this article analyzes price action exclusively for educational and informational purposes. It does not constitute, under any circumstances, financial advice, investment recommendations, or an invitation to trade digital assets. Crypto assets exhibit high volatility; only risk capital you are willing to lose.

Communications Professional. Crypto Enthusiast. Economic Journalist. Bitcoiner & Altcoiner.


