

The decentralized finance (DeFi) market keeps its eyes fixed on the Tron ecosystem, specifically on its governance token, SUN. After shaking off a prolonged 164-bar daily bearish structure, the crypto asset posts a positive year-to-date return of 6.85% so far in 2026, backed by a solid quarterly momentum of 21.64% and a year-over-year advance of 4.09%.
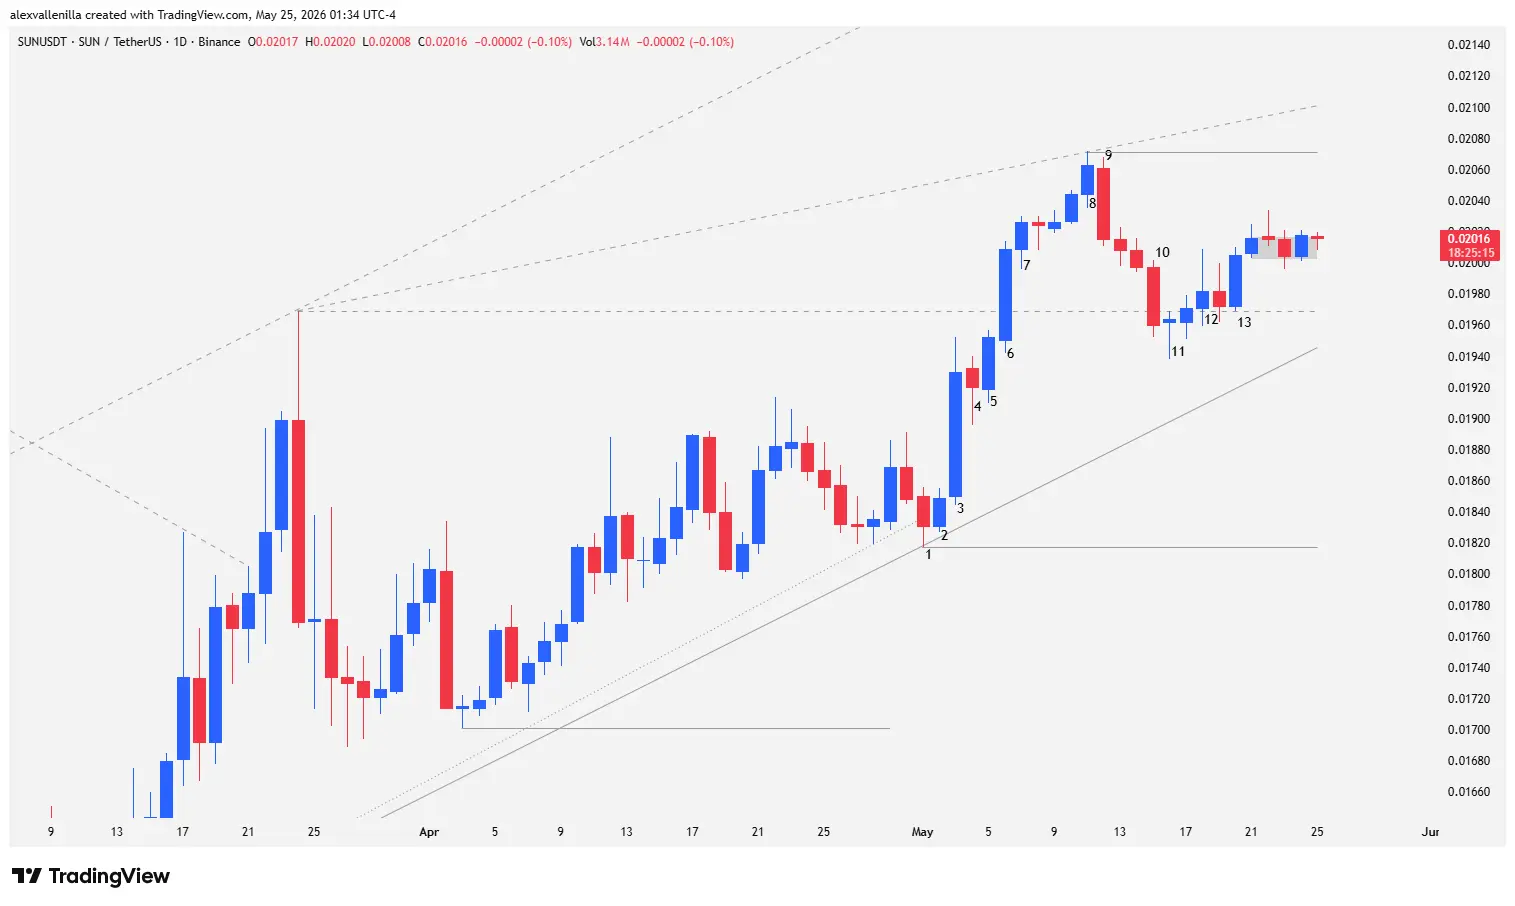
Despite early doubts that threatened to turn the market pivot into a bull trap, current price action on the daily (1D) chart reveals that institutional order flow continues to back buyers. The technical battle now concentrates on consolidating old resistance levels into new operational support.
Chart Anatomy: Bar-by-Bar Price Action Reading
Recent order flow behavior on the SUN 1D chart provides a clear narrative of supply and demand psychology across 13 key bars:
Bar 1: A narrow-range bearish candlestick that pierced a prior 61-bar bullish trendline. However, its low at $0.01817 served as a crucial structural anchor, validating a control point for a two-legged move. The bulls’ previous inability to test the $0.01969 resistance created the risk of a broader bull failure.
Bar 2: Prints a bullish inside bar. By registering a higher low, bears failed to follow through on the previous breakout, forcing the price back above the dynamic channel’s old lower boundary.
Bar 3: A volatility explosion favoring demand. This solid candle expanded its range by 4.38%, sweeping liquidity from previous highs and rapidly approaching the $0.01969 resistance, though falling just short of touching it.
Bar 4: A pause in the trend. It shows up as a small bearish inside bar with wicks on both ends, reflecting minor profit-taking after the previous bar’s effort.
Bar 5: A bullish candle that triggers a pullback failure by breaking above the high of Bar 4, proving buyers maintained control of the order flow despite not yet breaching the critical zone.
Bar 6: A high-quality breakout bar. With a robust body and little upper wick, buyers decisively cleared the $0.01969 resistance, closing more than half of the candle’s body above the level. Pure efficiency.
Bar 7: A modest bullish continuation bar that formally confirmed the validity of the institutional breakout.
Bar 8: The climax of the momentum. This candle marked a new local high at $0.02071. However, the three previous bars (including Bar 8) showed a climatic acceleration pattern (progressively larger bodies)—a structure that typically anticipates temporary exhaustion from buyers. This high also helped plot the upper line of a rising wedge, as price failed to reach the ceiling of the original 85-bar channel.
Bar 9: A strong bearish reversal. An engulfing candle that closed below the low of Bar 8, signaling massive profit-taking by smart money.
Bar 10: Continued selling pressure. This candle expanded its body downward in a climatic fashion compared to the previous two, forcing a close below the newly discovered support at $0.01969.
Bar 11: A key pivot via a bullish pin bar. Supply attempted to deepen the correction, but demand completely absorbed the sell orders at the lows, denying any bearish continuity from Bar 10.
Bar 12: Buyers retake control and push the daily close back above $0.01969, restoring its status as support. Although the upper wick was noticeably larger than the body, it demonstrated active absorption of residual supply. The subsequent bar acted as an inside bar and pullback failure.
Bar 13: Definite confirmation of the pullback failure. The close and high printed above the previous bar’s parameters, keeping the low safely above $0.01969. Following this bar, price entered a five-candle “barbed wire” congestion area, compressing near the base of the bullish channel.
Structural Projections: Two Mid-Term Scenarios
The technical structure slightly favors buying forces. Despite the formation of the rising wedge—a pattern that theoretically tends to resolve to the downside—bearish pullbacks lack harmony and cleanliness, showing high intraday volatility but little follow-through on daily closes.
Bullish Scenario: Moving Toward Bull Cycle Confirmation
If demand breaks the current congestion to the upside and clears the local resistance of Bar 8 at $0.02071, the rising wedge will fail its bearish nature, triggering a short squeeze acceleration. This move would project the price directly toward macro resistance at $0.02167, originating from the most significant high of the old 164-bar macro downtrend. Conquering and consolidating this level with solid candles will formally decree the start of a mid-to-long-term secular bull market for SUN.
Bearish Scenario: Invalidation of the Support Structure
Conversely, if buying volume fades and price loses the horizontal support at $0.01969—confluent with the channel base and a dynamic support zone at $0.01945—the immediate bullish structure will be invalidated. Under this outlook, SUN would seek a deep retest of its structural control point at $0.01817 (Bar 1 low), a level that must act as the final line of defense to prevent the entire current move from being classified as a deviation or a larger-scale bull trap.
SUN moves through a decisive reaccumulation phase during this stretch of 2026. Institutional capacity to defend the $0.01969 zone highlights a structural change in behavior; however, definitive volume will require breaching the wedge at $0.02071 to unleash long-term optimism.
Disclaimer: This analysis is presented for informational and educational purposes only. It does not constitute financial advice, investment recommendations, or an offer to trade digital assets. Crypto assets exhibit high volatility; conduct your own research before risking capital.

Communications Professional. Crypto Enthusiast. Economic Journalist. Bitcoiner & Altcoiner.


