

The decentralized finance and institutional-grade asset market is witnessing a technical turning point on the XDC Network (XDC) daily chart. Following an exhausting bearish dominance that confined the price for 448 days within a corrective structure, institutional order flow has begun to reverse the macro dynamics. The current price of $0.03258 reflects a 5.85% intraday gain, consolidating a structure of higher lows that threatens to redefine the medium- and long-term trend. This move is no coincidence; it responds to a violent psychological transition between retail capitulation and absorption by “strong hands.”
The Anatomy of the Breakout: From Accumulation to Spike and Range
The roadmap for XDC changed drastically upon completing a 72-bar accumulation phase above the critical support at $0.02949. Price action mutated from suffocating compression within a descending wedge toward a “spike and range” pattern, characterized by violent expansions of volatility followed by deep profit-taking.
Buyers took the initiative by drawing a new bullish trendline that already extends for 21 bars. However, the path is not linear. Each advance toward the upper bound of the range triggers limit sell orders from bears, who are defending the last bastion of the macro trend.
Candle Scanner: Radiography of the Order Flow Battle
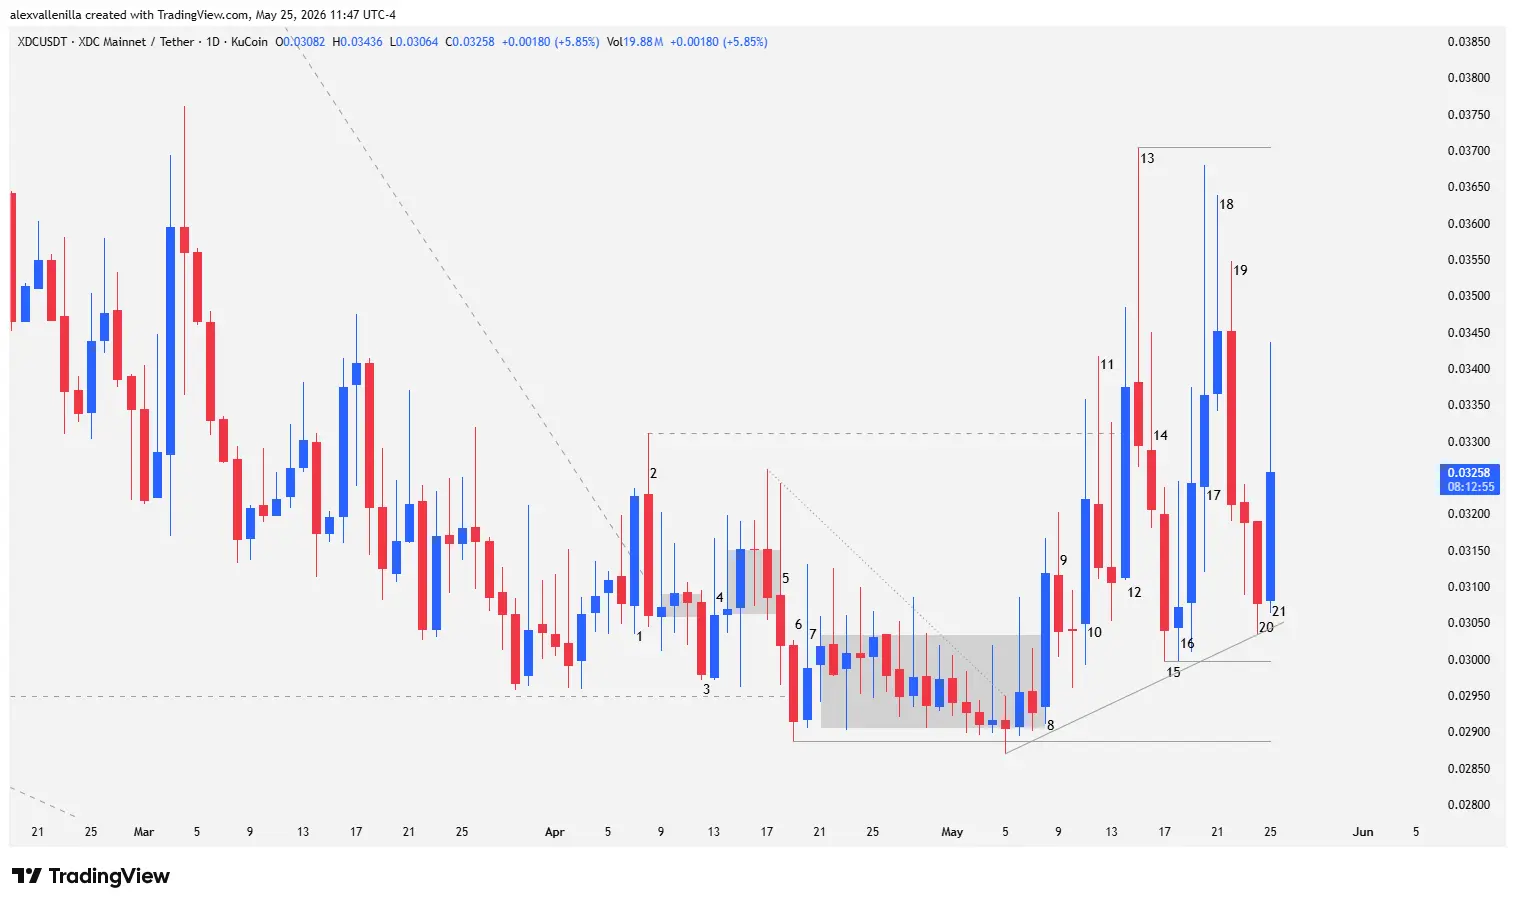
Below is a chronological and detailed analysis of price action behavior through its key bars:
The Origin of the Breakout and Supply Testing (Bars 1 to 7)
Bar 1: An imposing bullish candlestick with a 4.78% gain pierces the 448-day bearish trendline. The low volatility reflected in its small tails demonstrates high buying conviction during the escape from the descending wedge.
Bar 2: Bears react fiercely with a 5.09% drop. Although bulls marked a higher high at $0.03311, selling pressure forces a close below the broken trendline. This bull trap subjects the price to a “barbed wire” pattern or tight congestion for three sessions.
Bars 3 and 4: Bar 3 breaks the congestion to the downside with a clean body but fails to test support at $0.02949. Immediately, Bar 4 invalidates the bearish attempt due to a lack of follow-through, shifting the price into an expansive volatility pattern.
Bars 5 and 6: On Bar 5, supply prints a lower high against Bar 2, exhibiting a massive upper wick. Finally, Bar 6 pierces the previous support and establishes a new structural low at $0.02888. This bar is characterized by its efficiency: a solid body and an absence of tails.
Bar 7: Bulls defend the new low with a pinbar candlestick. Although the upper wick denotes resistance, the low remains above Bar 6. Following this, the price gets boxed into a 16-bar compression that strictly respects $0.02888, loading the liquidity spring.
The Injection of Institutional Volume (Bars 8 to 12)
Bar 8: The market resolves the compression to the upside with a violent 6.52% breakout candle, clearing the congestion highs and validating $0.02888 as the definitive floor.
Bar 9: Bears execute a minor pullback. Although they seek to trap breakout buyers, the close sits above the midpoint of Bar 8. The bearish failure to provide downside continuity (confirmed by a subsequent doji) reintroduces automated bids to the market.
Bar 10: Volatility explosion. Bulls drive a 5.92% candle that pierces resistance at $0.03311 (the high of Bar 2). Failing to close above this level, the chart warns that supply absorption still requires time.
Bar 11: A bearish pinbar candle with an upper wick doubling its body denotes profit-taking at resistance. Nonetheless, the bearish effort is futile: the close holds near the midpoint of Bar 10’s body, and the low generates a higher floor.
Bar 12: Institutional confirmation. With a convincing 8.66% bullish candlestick, buyers pulverize resistance at $0.03311. The total absence of a lower tail reveals that buy orders entered at market right from the daily open, closing above the pivot zone.
Climax, Bearish Capitulation, and the New Impulse (Bars 13 to 21)
Bars 13 and 14: Bar 13 stretches the price to a high of $0.03705, but supply repels the move, creating a wick three times the size of the candle body. Bar 14 provides continuity to this exhaustion pullback after three consecutive bullish impulses.
Bar 15: Bears attempt a massive 5.18% counterattack that threatens to invalidate breakout Bar 12. However, the body acceleration relative to the wicks betrays that this is a climactic capitulation bar. Bears burn their last cartridges without managing to touch key support.
Bar 16: Flow reversal via a bullish-closing pinbar. Failing to follow through on Bar 15’s drop, it traps late sellers (trapped bears). Additionally, its low matches the previous bar, creating a tweezer bottom that fixes a defensive higher low at $0.02998. The subsequent bar regains control with a 5.53% rally.
Bars 17 and 18: A wide-range bullish expansion (Bar 17) approaches the highs of Bar 13 without testing them. Bar 18 contracts as a pinbar inside bar with an upper wick, signaling temporary fatigue near resistance.
Bars 19 and 20: Detecting buyer exhaustion, supply slams a solid, engulfing 6.92% candle (Bar 19). However, bearish momentum stops dead on Bar 20, which exhibits a 20% lower wick and establishes a higher low that protects the $0.02998 structure. This pivot allows the drawing of a dynamic medium-term bullish trendline.
Bar 21 (Developing): At the time of writing this report, the candle trades at $0.03258 with a 5.85% return. Although the upper wick highlights ongoing battles in the daily order flow, the higher low meticulously preserves the health of the nascent bullish trend.
Where the Price is Headed
The technical map of XDC Network reveals that the current structure of accumulation and ascending spikes seeks to purge floating supply before the next major quantitative leap. The immediate objective for bulls lies in definitively beating the wall at $0.03705 (the high of Bar 13).
A confirmed and consolidated breakout above that level will clear the path toward the true long-term catalyst: macro resistance at $0.05480. This technical level represents the last lower high of the 448-day structure; conquering it would mark the mathematical end of the crypto winter for XDC and the birth of a bullish cycle of institutional proportions.
Disclaimer: This analysis is issued exclusively for informational and educational purposes based on price action methodologies. It does not constitute, under any circumstances, financial advice, an investment recommendation, or a solicitation to buy/sell digital assets.

Communications Professional. Crypto Enthusiast. Economic Journalist. Bitcoiner & Altcoiner.


