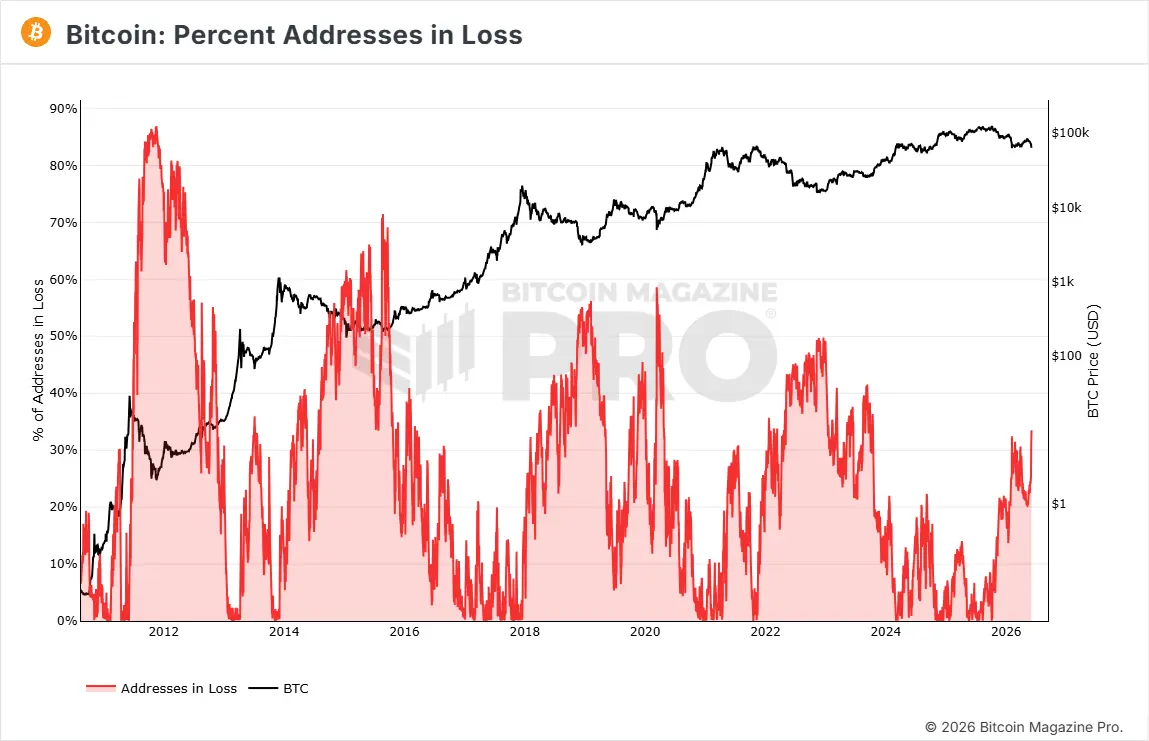
The blockchain money map just flashed one of the most closely watched signals by analysts and institutional investors. According to recent data from Bitcoin Magazine Pro, the percentage of bitcoin addresses in loss (or with unrealized losses) climbed to 33.50% on June 4, with the asset’s price averaging $63,800. This spike in the metric marks a silent capitulation zone that has historically served as the prelude to major bullish reversals.
The Ghost of October 2023 and Cycle Maturation
This proportion of wallets “in the red” represents a milestone not recorded since October 16, 2023, when addresses in loss hit 33.48% while bitcoin traded at just $28,500. Practically speaking, the market has had to wait nearly three years to experience a similar concentration of underwater holders in proportional terms.
Current behavior outpaces the stress peak of February 5, 2026, when the indicator reached 32.44% at a price of $62,900. At that time, the sharp price shakeout triggered a capitulation that quickly reversed with a macro bounce, compressing addresses in loss to just 20.07% on May 10, 2026, and driving the price up to $82,000.
Looking further back, the ecosystem’s most severe structural bottom occurred on December 19, 2022. On that post-FTX day, addresses in loss devoured 49.78% of the network at a price of $16,400. That absolute floor served as the engine fueling the massive bull rally to the all-time high of $126,000 recorded in October 2025.
Strong Hands and Illiquid Supply on the Blockchain
The on-chain interpretation of this data is clear and educational: addresses remaining in loss during corrections mostly belong to long-term investors or “strong hand” holders. These players keep their assets in self-custody wallets and refuse to sell despite market volatility.
When the percentage of addresses in loss increases so aggressively, the blockchain warns us that downward moves are hitting a high-density support zone. Investors choose not to realize losses at discount prices; as available supply on exchanges shrinks drastically, even minimal capital inflows tend to skyrocket the price. This follows the exact textbook dynamic we saw in February 2019 (when the peak loss reached 56.20% with the asset at $3,359) and in March 2020 (with 58.22% losses during the pandemic crash down to $5,130 before the major expansion).
At a macroeconomic level, the 2026 context adds another layer to the analysis. Global liquidity and Federal Reserve (Fed) policies show that, while monetary tightening has begun to ease slowly, large capital allocators use these contractions to accumulate volume. This explains why current loss peaks are progressively lower: the Bitcoin network is experiencing a phase of lower institutional volatility and greater technical maturation.
Confirmed Bottom or Liquidity Trap?
The indicator’s current behavior strongly suggests that bitcoin could be hitting or consolidating its macro bottom within the current range. However, nothing is definitive in price action. Although illiquid supply is responding, the current metric does not guarantee an immediate bounce or signal the green light for a new vertical uptrend. Traders should closely watch the consolidation of $62,500 as the primary technical support before projecting higher targets.
Disclaimer: This content is purely informational and educational. On-chain data and market analysis do not constitute financial advice or investment recommendations. Every investor must conduct their own research before committing capital to crypto assets.
Communications Professional. Crypto Enthusiast. Economic Journalist. Bitcoiner & Altcoiner.