The cryptocurrency market is facing a highly volatile bearish re-evaluation. During the last session, Ripple’s XRP token broke a key range structure that had supported its price for 113 days, piercing critical support at $1.27 and the structural trend low at $1.1172. After buyers failed to break above a 322-bar primary descending trendline, institutional order flow took absolute control of the daily chart (1D). This movement invalidates short-term bullish theses and immediately opens the door to the dynamic support zone at $0.9785, with a lingering risk of targeting late-2024 lows near $0.50 if supply is not absorbed immediately.
Failure at the Top: A Classic Bull Trap
XRP/USD price action demonstrates that sellers still dominate the macro structure. After a prolonged accumulation period, demand’s inability to sustain bullish breakouts triggered a violent reversal in order flow, triggering stop-loss orders for lagging buyers and fueling the conviction of market whales.
Price Action Technical Analysis (1D Chart)
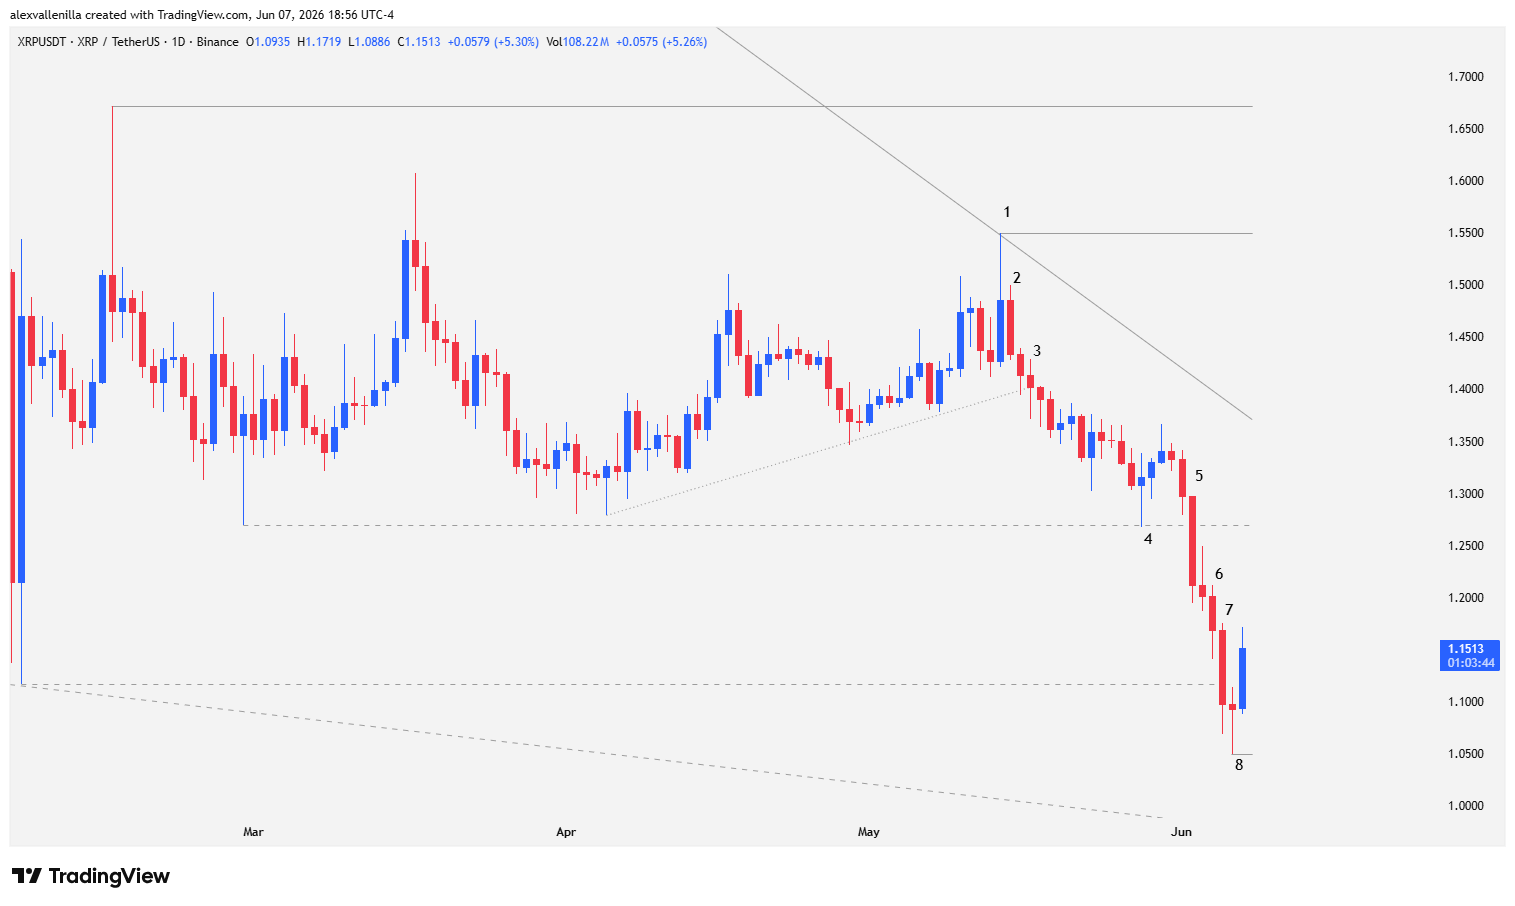
Bar 1: The price prints a high that acts as an exact technical anchor to adjust the primary descending trendline, which has been valid for 322 bars. Given the clear inability to break above this trendline, the high of this session turns into a structural resistance that liquidates buying pressure, leaving it far from the historical and psychological target at $1.6714.
Bar 2: This session develops as a consolidating Inside Bar. Incapable of breaking the high of Bar 1, it invalidates any hint of a bullish breakout. The candle’s close reflects strong bearish conviction where institutional activity begins shorting the market.
Bar 3: A bearish Doji bar forms, decisively piercing the lower boundary of a 42-bar bullish microchannel. This microchannel operated internally within a wider range bound by resistance at $1.6714 and critical support at $1.27. Following the breakout, the price enters a highly tight bearish microchannel, beginning its descent toward the range floor.
Bar 4: The low of this session directly tests support at $1.27. The appearance of this Doji introduces uncertainty into the price action and temporarily halts the downside momentum due to a brief pause in bearish order flow.
Structural Breakout and Range Capitulation
Bar 5: Sellers assume full control of the market through a high-conviction, wide-range candle that crashes the price by more than 6%. Bears set the pace right from the open, as evidenced by the complete absence of an upper wick. The candle body closes almost entirely below $1.27, cleanly breaking a sideways range structure that had been successfully defended for 113 bars. This technical move liquidates the structure and drives the price toward the last fixed support of the macro trend at $1.1172.
Bar 6: This prints as a bearish continuation candle. Although it exhibits less intent and a smaller range than its predecessor, it confirms the validity of the Bar 5 breakout and keeps the bias of sell orders in the book.
Bar 7: Another high-impact institutional session. This bearish candle covers nearly the entire daily trading range and successfully pierces structural and historical support at $1.1172 (the final low of the 322-bar macro trend). This breakout sends an unequivocal signal of a generalized bearish resumption. With this move, XRP enters a liquidity void, trapped between this broken level and dynamic support at $0.9785, which aligns with the base of a falling wedge formation.
Bar 8: The session low establishes temporary support at $1.0501. It forms a Doji with a lower wick, showing initial supply absorption by retail demand. However, the tight range of the bar proves that buying volume is still insufficient to print a definitive bottom.
Macro Outlook: The Key Scenarios
The current technical context leaves Ripple in an extremely vulnerable position. If the base of the falling wedge in the $0.9785 area gives way to institutional selling pressure, XRP will lack medium-term structural support. This would trigger a rapid drop toward the psychological $0.50 band, levels not seen since the end of 2024.
Conversely, for a reversal or relief rally scenario to unfold, demand must step in aggressively to absorb floating supply around $1.0501. A successful technical bounce would target the $1.27 area as its first major objective and primary resistance—the old support of the 113-bar range—which will now act as a zone of technical polarity and major resistance.
Disclaimer: This analysis is conducted exclusively for informational and educational purposes based on price action. It does not constitute financial advice, investment recommendations, or an offer to buy or sell crypto assets. Trading digital currencies carries a high risk of capital loss.
Communications Professional. Crypto Enthusiast. Economic Journalist. Bitcoiner & Altcoiner.