The crypto market does not forgive naive optimism. Dashcoin (DASH) is currently staging an intense battle of crowd psychology reflected in its charts, where institutional liquidity subjects retail buyers to sophisticated market traps. After breaking a macro bearish structure of 157 bars, the crypto asset now faces a distributive crossroads, trapped between a stubborn descending trendline and a key support wall that bears fail to demolish.

Anatomy of a “Bull Trap”: The Absorption of Institutional Demand
DASH’s attempted bullish reversal ground to a screeching halt due to the relentless strategy of the smart money: “Sell the Rally.” The initial upward impulses were nothing more than bait.
Massive supply activated surgically in key congestion zones, halting the price before it could threaten the historical resistance at $96.85. This aggressive injection of selling liquidity neutralized buyers’ momentum through consecutive traps, forcing price into a retracement and technical reconfiguration process under the influence of the 20-period Exponential Moving Average (EMA 20).
Price Action: Bar-by-Bar Order Flow Reading
To understand the underlying market psychology, it is imperative to break down price behavior through its candlesticks and their interaction with dynamic levels:
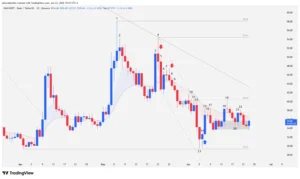
Bar 1: A climatic pinbar with a prominent upper tail denoting massive absorption of demand. Bears liquidated buyers amid high volatility, establishing solid resistance at $58.09.
Bar 2: Inside bars that functioned as an EMA gap bar above the moving average. This evidenced that, despite breaking the previous 157-bar trend, sellers executed dynamic traps, forcing a correction that pierced below the EMA 20.
Bar 3: A colossal, wide-range bullish conviction bar with no tails. This represents institutional activity and intent, but its excessive size penalized the risk/reward ratio, raising the probability of failure when trading counter-trend.
Bar 4: Failed test. Buyers failed to reach the $58.09 resistance, printing a lower high at $52.42. The large upper tail confirmed a new bull trap, serving as the anchor for a new 158-bar descending trendline.
Bar 5: Confirmation of bearish bias. A wide-range bar driven by smart money that breached the EMA 20. Although it validated the short direction and triggered sell signals, its size again complicated risk management.
Bars 6 to 8: After an attempted reversal above the EMA 20 (Bar 6), the market entered indecision with a narrow-range doji (Bar 7). Finally, Bar 8 validated a high-probability, low-risk Low 2 sell setup by breaking downward through the EMA 20.
Bars 9 to 11: Bar 9 accelerated the drop into a four-candle congestion zone. Bar 10 broke that stagnation, while Bar 11 acted as an inside bar, establishing local resistance at $40.40 and serving as the anchor for a 17-bar bearish microchannel.
Bars 12 and 13: Bar 12 was a high-conviction capitulation bar with no tails, where smart money liquidated positions. Bar 13 provided continuity to the movement, but its low failed to test the critical support at $29.31, showing a deceleration in selling pressure.
Bars 14 to 17: Bulls reacted with a consolidating inside bar (Bar 14) and confirmed the reversal in Bar 15, breaking the 17-candle microchannel with institutional volume, though its high remained blocked below the EMA 20. After a doji (Bar 16), bears attempted to regain control in Bar 17, but price hit a “barbed wire” support structure.
Bars 18 to 22: Bar 18 broke the congestion and cleared the EMA 20. However, volatility in Bar 19 left a long upper tail, triggering a three-candle retracement. Bar 20 (tiny and contracting) tested the previous congestion zone as support, followed by a slight bullish fakeout (Bar 21) and a marginal correction (Bar 22) that keeps price compressed sideways over support.
Macro Perspective: The Double Bottom Pattern and Key Scenarios
The macro-level behavior of the asset reveals a landscape of technical resilience. Despite registering a 22.14% loss over the past month, Dashcoin preserves an outstanding positive return of 94.97% year-over-year (last 12 months).
Currently, the bears’ rejection to pierce key support at $29.31 (a low that has not been tested in the last 82 bars) is forming a Double Bottom technical structure. This accumulation pattern exposes clear price compression: highs are descending, pressured by the 158-bar trendline, but lows refuse to give way.
Resolution Scenarios:
Bullish Scenario: Buyers need to reclaim the EMA 20 sustainably and beat local resistance at $40.40 (high of Bar 11). This would validate the Double Bottom and grant the necessary momentum to attack the major 158-bar bearish trendline.
Bearish Scenario: If supply definitively breaks technical support at $29.31, it would invalidate the accumulation structure, resuming the macro downtrend toward new all-time lows.
Dashcoin finds itself in a crucial volatility compression phase. The inability of smart money to break the $29.31 level opens the door to a bullish resolution via the Double Bottom, provided that order flow manages to absorb resistance at $40.40.
Disclaimer: The information set forth in this article is for purely educational and informational purposes and does not, under any circumstances, constitute financial advice or an investment proposal.
Communications Professional. Crypto Enthusiast. Economic Journalist. Bitcoiner & Altcoiner.